Hinweis
Zum Ende springen, um den vollständigen Beispielcode herunterzuladen.
Mehrere Subplots mit plt.subplots erstellen#
pyplot.subplots erstellt mit einem einzigen Aufruf eine Figure und ein Gitter von Subplots und bietet dabei eine angemessene Kontrolle darüber, wie die einzelnen Plots erstellt werden. Für fortgeschrittenere Anwendungsfälle können Sie GridSpec für ein allgemeineres Subplot-Layout oder Figure.add_subplot zum Hinzufügen von Subplots an beliebigen Stellen innerhalb der Figure verwenden.
Eine Figure mit nur einem Subplot#
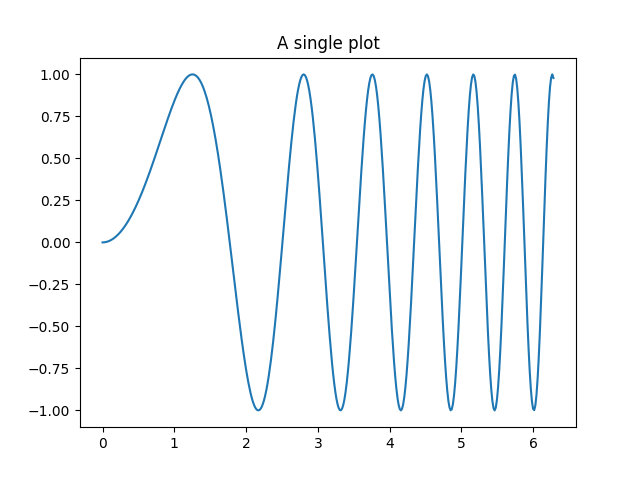
subplots() gibt ohne Argumente eine Figure und eine einzelne Axes zurück.
Dies ist tatsächlich der einfachste und empfohlene Weg, eine einzelne Figure und Axes zu erstellen.
fig, ax = plt.subplots()
ax.plot(x, y)
ax.set_title('A single plot')
Subplots in einer Richtung stapeln#
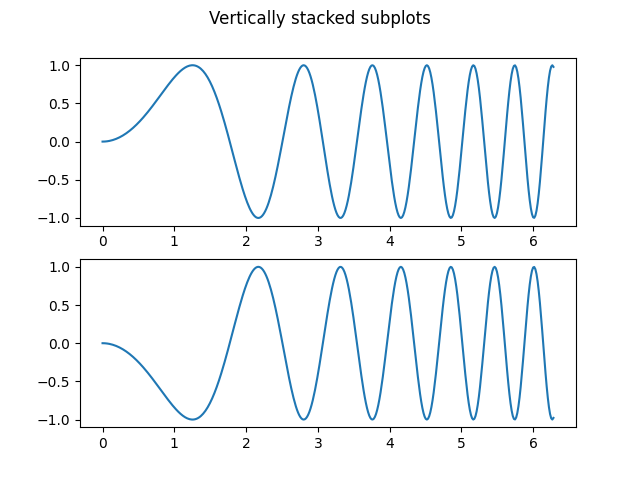
Die ersten beiden optionalen Argumente von pyplot.subplots definieren die Anzahl der Zeilen und Spalten des Subplot-Gitters.
Beim Stapeln nur in einer Richtung ist die zurückgegebene axs ein 1D-NumPy-Array, das die Liste der erstellten Axes enthält.
fig, axs = plt.subplots(2)
fig.suptitle('Vertically stacked subplots')
axs[0].plot(x, y)
axs[1].plot(x, -y)

Wenn Sie nur wenige Axes erstellen, ist es praktisch, diese sofort in dedizierte Variablen für jede Axes zu entpacken. Auf diese Weise können wir ax1 anstelle des umständlicheren axs[0] verwenden.
fig, (ax1, ax2) = plt.subplots(2)
fig.suptitle('Vertically stacked subplots')
ax1.plot(x, y)
ax2.plot(x, -y)
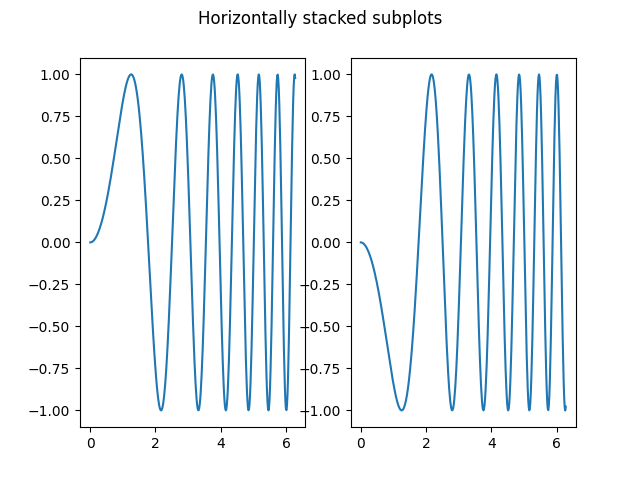
Um nebeneinander liegende Subplots zu erhalten, übergeben Sie die Parameter 1, 2 für eine Zeile und zwei Spalten.
fig, (ax1, ax2) = plt.subplots(1, 2)
fig.suptitle('Horizontally stacked subplots')
ax1.plot(x, y)
ax2.plot(x, -y)
Subplots in zwei Richtungen stapeln#
Beim Stapeln in zwei Richtungen ist die zurückgegebene axs ein 2D-NumPy-Array.
Wenn Sie Parameter für jeden Subplot festlegen müssen, ist es praktisch, alle Subplots in einem 2D-Gitter mit for ax in axs.flat: zu durchlaufen.
fig, axs = plt.subplots(2, 2)
axs[0, 0].plot(x, y)
axs[0, 0].set_title('Axis [0, 0]')
axs[0, 1].plot(x, y, 'tab:orange')
axs[0, 1].set_title('Axis [0, 1]')
axs[1, 0].plot(x, -y, 'tab:green')
axs[1, 0].set_title('Axis [1, 0]')
axs[1, 1].plot(x, -y, 'tab:red')
axs[1, 1].set_title('Axis [1, 1]')

for ax in axs.flat:
    ax.set(xlabel='x-label', ylabel='y-label')

# Hide x labels and tick labels for top plots and y ticks for right plots.
for ax in axs.flat:
    ax.label_outer()
![Axis [0, 0], Axis [0, 1], Axis [1, 0], Axis [1, 1]](../../_images/sphx_glr_subplots_demo_005.png)
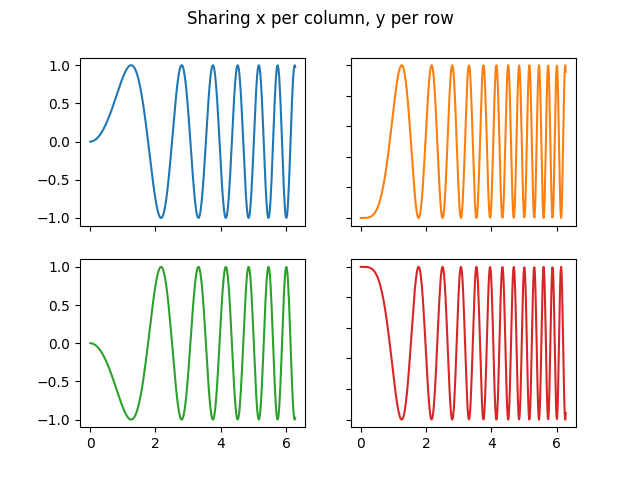
Sie können auch in 2D Tupel-Entpackung verwenden, um alle Subplots dedizierten Variablen zuzuweisen
fig, ((ax1, ax2), (ax3, ax4)) = plt.subplots(2, 2)
fig.suptitle('Sharing x per column, y per row')
ax1.plot(x, y)
ax2.plot(x, y**2, 'tab:orange')
ax3.plot(x, -y, 'tab:green')
ax4.plot(x, -y**2, 'tab:red')

for ax in fig.get_axes():
    ax.label_outer()
Achsen teilen#
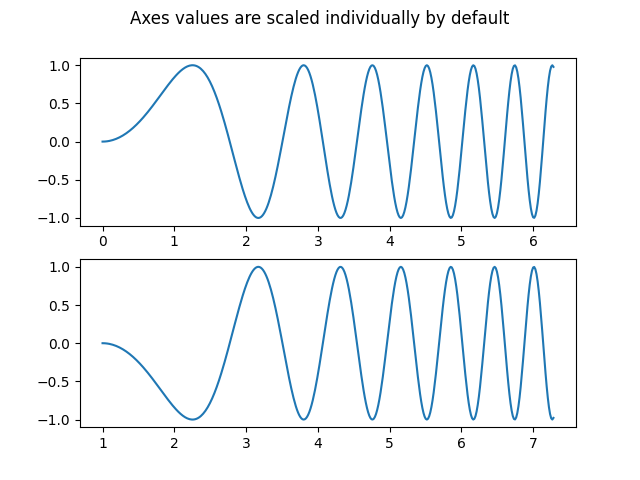
Standardmäßig wird jede Axes individuell skaliert. Wenn die Bereiche unterschiedlich sind, stimmen die Tick-Werte der Subplots nicht überein.
fig, (ax1, ax2) = plt.subplots(2)
fig.suptitle('Axes values are scaled individually by default')
ax1.plot(x, y)
ax2.plot(x + 1, -y)
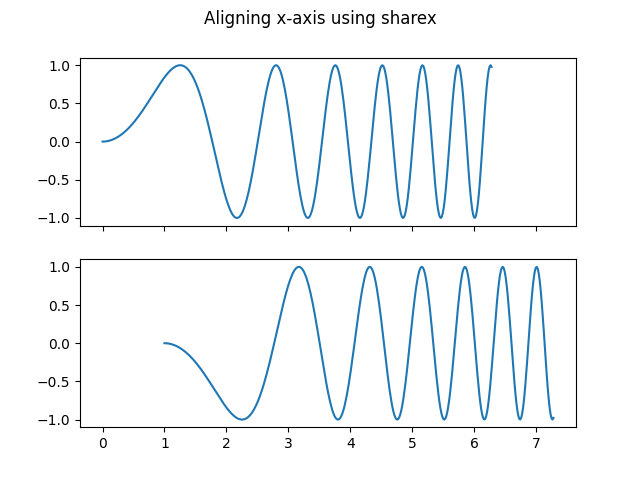
Sie können sharex oder sharey verwenden, um die horizontale oder vertikale Achse auszurichten.
fig, (ax1, ax2) = plt.subplots(2, sharex=True)
fig.suptitle('Aligning x-axis using sharex')
ax1.plot(x, y)
ax2.plot(x + 1, -y)
Das Setzen von sharex oder sharey auf True ermöglicht die globale gemeinsame Nutzung über das gesamte Gitter, d. h. auch die y-Achsen von vertikal gestapelten Subplots haben die gleiche Skalierung, wenn sharey=True verwendet wird.
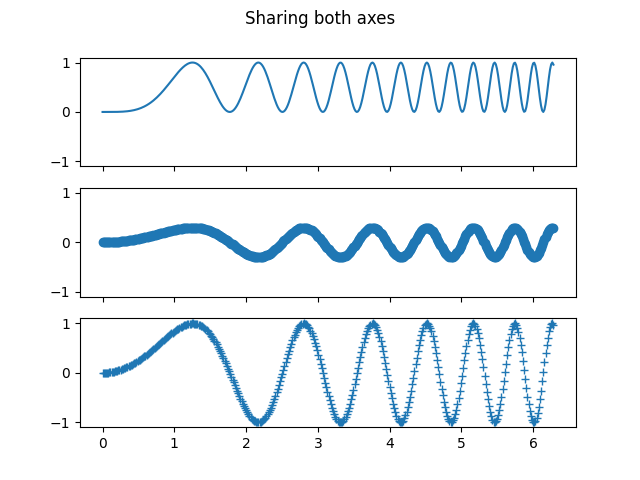
Für Subplots, die Achsen teilen, ist ein Satz von Tick-Beschriftungen ausreichend. Tick-Beschriftungen der inneren Axes werden automatisch von sharex und sharey entfernt. Dennoch bleibt ein ungenutzter leerer Raum zwischen den Subplots.
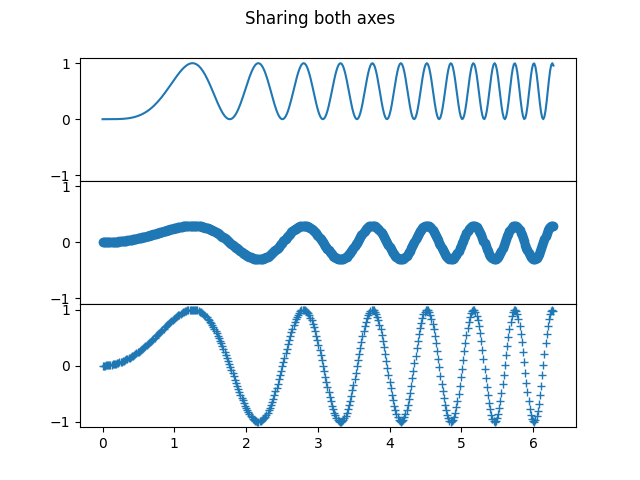
Um die Positionierung der Subplots präzise zu steuern, kann man explizit ein GridSpec mit Figure.add_gridspec erstellen und dann dessen subplots-Methode aufrufen. Zum Beispiel können wir den Abstand zwischen vertikalen Subplots mit add_gridspec(hspace=0) verringern.
label_outer ist eine praktische Methode, um Beschriftungen und Ticks von Subplots zu entfernen, die sich nicht am Rand des Gitters befinden.
fig = plt.figure()
gs = fig.add_gridspec(3, hspace=0)
axs = gs.subplots(sharex=True, sharey=True)
fig.suptitle('Sharing both axes')
axs[0].plot(x, y ** 2)
axs[1].plot(x, 0.3 * y, 'o')
axs[2].plot(x, y, '+')

# Hide x labels and tick labels for all but bottom plot.
for ax in axs:
    ax.label_outer()
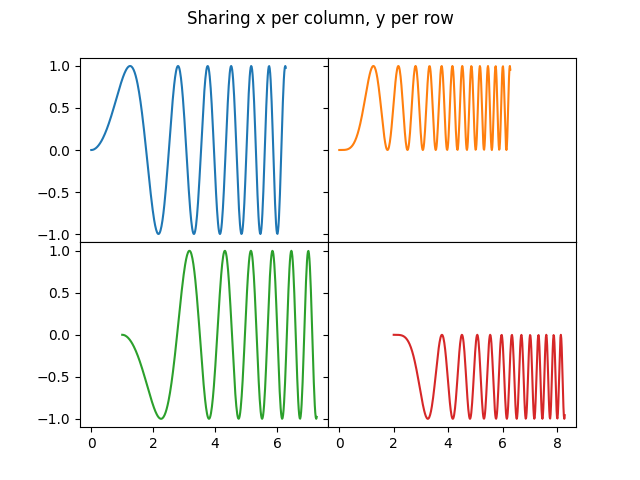
Abgesehen von True und False akzeptieren sowohl sharex als auch sharey die Werte 'row' und 'col', um die Werte nur pro Zeile oder Spalte zu teilen.
fig = plt.figure()
gs = fig.add_gridspec(2, 2, hspace=0, wspace=0)
(ax1, ax2), (ax3, ax4) = gs.subplots(sharex='col', sharey='row')
fig.suptitle('Sharing x per column, y per row')
ax1.plot(x, y)
ax2.plot(x, y**2, 'tab:orange')
ax3.plot(x + 1, -y, 'tab:green')
ax4.plot(x + 2, -y**2, 'tab:red')

for ax in fig.get_axes():
    ax.label_outer()
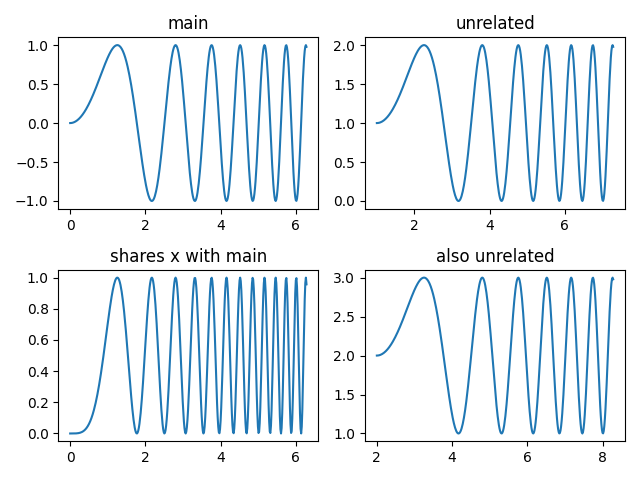
Wenn Sie eine komplexere Teilungsstruktur wünschen, können Sie zuerst das Gitter von Axes ohne Teilung erstellen und dann axes.Axes.sharex oder axes.Axes.sharey aufrufen, um nachträglich Teilungsinformationen hinzuzufügen.
fig, axs = plt.subplots(2, 2)
axs[0, 0].plot(x, y)
axs[0, 0].set_title("main")
axs[1, 0].plot(x, y**2)
axs[1, 0].set_title("shares x with main")
axs[1, 0].sharex(axs[0, 0])
axs[0, 1].plot(x + 1, y + 1)
axs[0, 1].set_title("unrelated")
axs[1, 1].plot(x + 2, y + 2)
axs[1, 1].set_title("also unrelated")
fig.tight_layout()
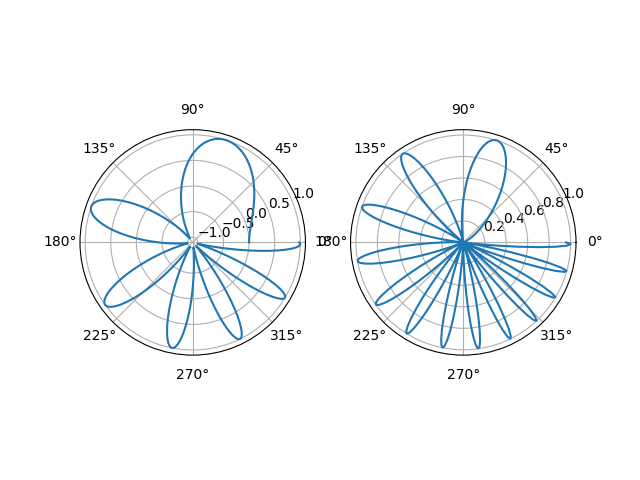
Polar-Axes#
Der Parameter subplot_kw von pyplot.subplots steuert die Eigenschaften des Subplots (siehe auch Figure.add_subplot). Insbesondere kann dieser verwendet werden, um ein Gitter von Polar-Axes zu erstellen.
Gesamtlaufzeit des Skripts: (0 Minuten 7,941 Sekunden)