Hinweis
Zum Ende gehen, um den vollständigen Beispielcode herunterzuladen.
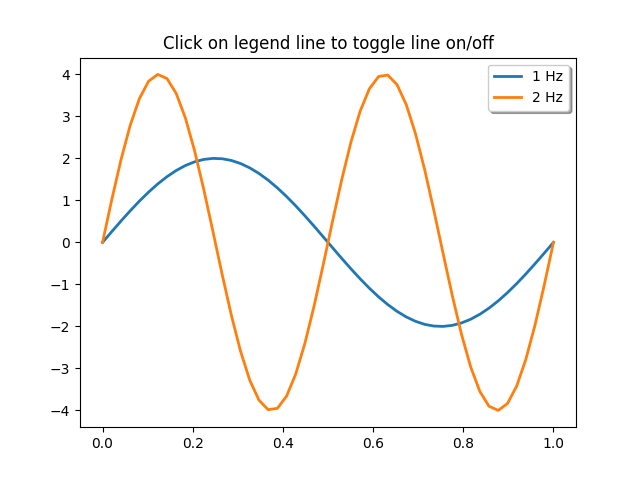
Legenden-Auswahl#
Aktivieren Sie die Auswahl in der Legende, um die ursprüngliche Linie ein- und auszublenden
Hinweis
Dieses Beispiel demonstriert die interaktiven Fähigkeiten von Matplotlib und wird nicht in der statischen Dokumentation angezeigt. Bitte führen Sie diesen Code auf Ihrem Computer aus, um die Interaktivität zu sehen.
Sie können einzelne Teile kopieren und einfügen oder das gesamte Beispiel über den Link am Ende der Seite herunterladen.
import matplotlib.pyplot as plt
import numpy as np

t = np.linspace(0, 1)
y1 = 2 * np.sin(2 * np.pi * t)
y2 = 4 * np.sin(2 * np.pi * 2 * t)

fig, ax = plt.subplots()
ax.set_title('Click on legend line to toggle line on/off')
(line1, ) = ax.plot(t, y1, lw=2, label='1 Hz')
(line2, ) = ax.plot(t, y2, lw=2, label='2 Hz')
leg = ax.legend(fancybox=True, shadow=True)

lines = [line1, line2]
map_legend_to_ax = {}  # Will map legend lines to original lines.

pickradius = 5  # Points (Pt). How close the click needs to be to trigger an event.

for legend_line, ax_line in zip(leg.get_lines(), lines):
    legend_line.set_picker(pickradius)  # Enable picking on the legend line.
    map_legend_to_ax[legend_line] = ax_line


def on_pick(event):
    # On the pick event, find the original line corresponding to the legend
    # proxy line, and toggle its visibility.
    legend_line = event.artist

    # Do nothing if the source of the event is not a legend line.
    if legend_line not in map_legend_to_ax:
        return

    ax_line = map_legend_to_ax[legend_line]
    visible = not ax_line.get_visible()
    ax_line.set_visible(visible)
    # Change the alpha on the line in the legend, so we can see what lines
    # have been toggled.
    legend_line.set_alpha(1.0 if visible else 0.2)
    fig.canvas.draw()


fig.canvas.mpl_connect('pick_event', on_pick)

# Works even if the legend is draggable. This is independent from picking legend lines.
leg.set_draggable(True)

plt.show()