Hinweis
Zum Ende springen, um den vollständigen Beispielcode herunterzuladen.
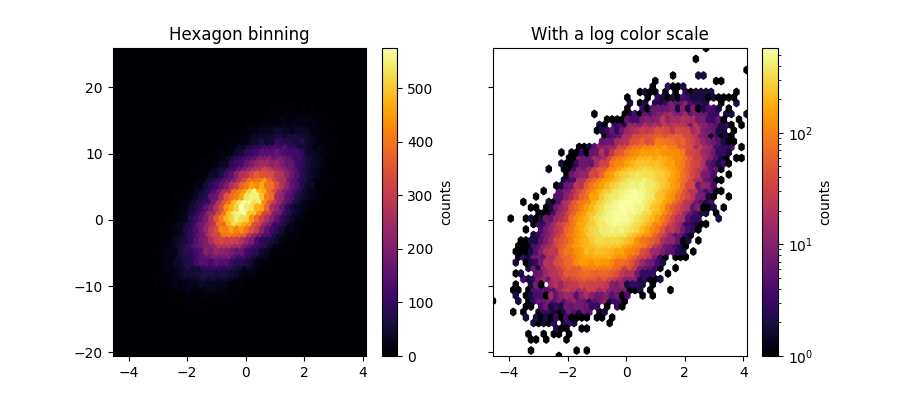
Hexagonal gebinnter Plot#
hexbin ist ein 2D-Histogramm-Plot, bei dem die Bins Sechsecke sind und die Farbe die Anzahl der Datenpunkte innerhalb jedes Bins darstellt.
import matplotlib.pyplot as plt
import numpy as np

# Fixing random state for reproducibility
np.random.seed(19680801)

n = 100_000
x = np.random.standard_normal(n)
y = 2.0 + 3.0 * x + 4.0 * np.random.standard_normal(n)
xlim = x.min(), x.max()
ylim = y.min(), y.max()

fig, (ax0, ax1) = plt.subplots(ncols=2, sharey=True, figsize=(9, 4))

hb = ax0.hexbin(x, y, gridsize=50, cmap='inferno')
ax0.set(xlim=xlim, ylim=ylim)
ax0.set_title("Hexagon binning")
cb = fig.colorbar(hb, ax=ax0, label='counts')

hb = ax1.hexbin(x, y, gridsize=50, bins='log', cmap='inferno')
ax1.set(xlim=xlim, ylim=ylim)
ax1.set_title("With a log color scale")
cb = fig.colorbar(hb, ax=ax1, label='counts')

plt.show()
Referenzen
Die Verwendung der folgenden Funktionen, Methoden, Klassen und Module wird in diesem Beispiel gezeigt
Gesamtlaufzeit des Skripts: (0 Minuten 1,614 Sekunden)