Hinweis
Gehen Sie zum Ende, um den vollständigen Beispielcode herunterzuladen.
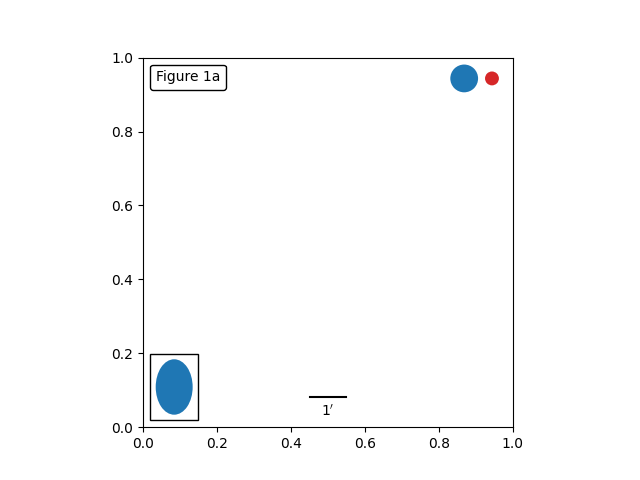
Verankerte Künstler#
Dieses Beispiel veranschaulicht die Verwendung von verankerten Objekten ohne die Hilfsklassen, die in mpl_toolkits.axes_grid1 zu finden sind. Diese Version der Abbildung ähnelt der in Einfache verankerte Künstler gefundenen, ist aber nur unter Verwendung des Matplotlib-Namensraums und ohne die Hilfe zusätzlicher Toolkits implementiert.
from matplotlib import pyplot as plt
from matplotlib.lines import Line2D
from matplotlib.offsetbox import (AnchoredOffsetbox, AuxTransformBox,
                                  DrawingArea, TextArea, VPacker)
from matplotlib.patches import Circle, Ellipse


def draw_text(ax):
    """Draw a text-box anchored to the upper-left corner of the figure."""
    box = AnchoredOffsetbox(child=TextArea("Figure 1a"),
                            loc="upper left", frameon=True)
    box.patch.set_boxstyle("round,pad=0.,rounding_size=0.2")
    ax.add_artist(box)


def draw_circles(ax):
    """Draw circles in axes coordinates."""
    area = DrawingArea(width=40, height=20)
    area.add_artist(Circle((10, 10), 10, fc="tab:blue"))
    area.add_artist(Circle((30, 10), 5, fc="tab:red"))
    box = AnchoredOffsetbox(
        child=area, loc="upper right", pad=0, frameon=False)
    ax.add_artist(box)


def draw_ellipse(ax):
    """Draw an ellipse of width=0.1, height=0.15 in data coordinates."""
    aux_tr_box = AuxTransformBox(ax.transData)
    aux_tr_box.add_artist(Ellipse((0, 0), width=0.1, height=0.15))
    box = AnchoredOffsetbox(child=aux_tr_box, loc="lower left", frameon=True)
    ax.add_artist(box)


def draw_sizebar(ax):
    """
    Draw a horizontal bar with length of 0.1 in data coordinates,
    with a fixed label center-aligned underneath.
    """
    size = 0.1
    text = r"1$^{\prime}$"
    sizebar = AuxTransformBox(ax.transData)
    sizebar.add_artist(Line2D([0, size], [0, 0], color="black"))
    text = TextArea(text)
    packer = VPacker(
        children=[sizebar, text], align="center", sep=5)  # separation in points.
    ax.add_artist(AnchoredOffsetbox(
        child=packer, loc="lower center", frameon=False,
        pad=0.1, borderpad=0.5))  # paddings relative to the legend fontsize.


fig, ax = plt.subplots()
ax.set_aspect(1)

draw_text(ax)
draw_circles(ax)
draw_ellipse(ax)
draw_sizebar(ax)

plt.show()