Hinweis
Zum Ende springen, um den vollständigen Beispielcode herunterzuladen.
Manuelle Konturen#
Beispiel für die Anzeige eigener Konturlinien und Polygone mit ContourSet.
import matplotlib.pyplot as plt

import matplotlib.cm as cm
from matplotlib.contour import ContourSet
from matplotlib.path import Path
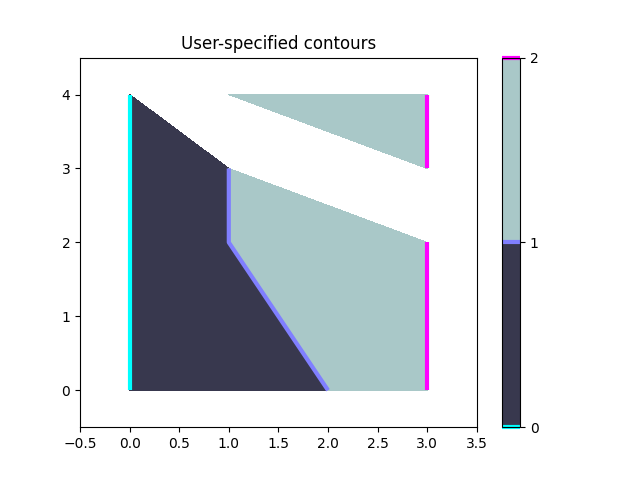
Konturlinien für jedes Level sind eine Liste/ein Tupel von Polygonen.
Gefüllte Konturen zwischen zwei Levels sind ebenfalls eine Liste/ein Tupel von Polygonen. Punkte können im oder gegen den Uhrzeigersinn geordnet sein.
fig, ax = plt.subplots()

# Filled contours using filled=True.
cs = ContourSet(ax, [0, 1, 2], [filled01, filled12], filled=True, cmap=cm.bone)
cbar = fig.colorbar(cs)

# Contour lines (non-filled).
lines = ContourSet(
    ax, [0, 1, 2], [lines0, lines1, lines2], cmap=cm.cool, linewidths=3)
cbar.add_lines(lines)

ax.set(xlim=(-0.5, 3.5), ylim=(-0.5, 4.5),
       title='User-specified contours')
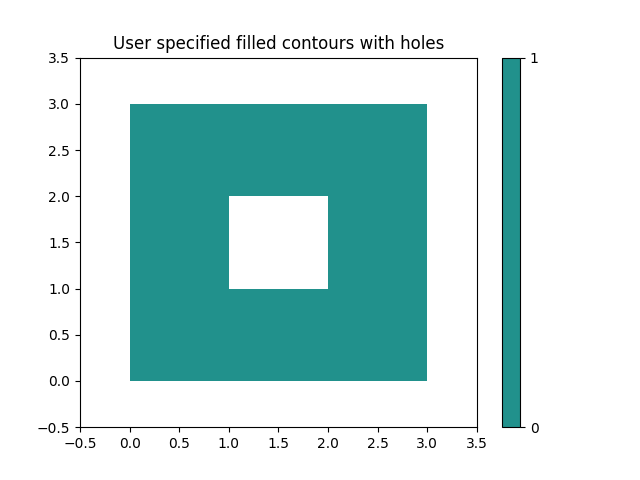
Mehrere gefüllte Konturlinien können in einer einzigen Liste von Polygonvertices zusammen mit einer Liste von Vertexarten (Code-Typen) angegeben werden, wie in der Path-Klasse beschrieben. Dies ist besonders nützlich für Polygone mit Löchern.
fig, ax = plt.subplots()
filled01 = [[[0, 0], [3, 0], [3, 3], [0, 3], [1, 1], [1, 2], [2, 2], [2, 1]]]
M = Path.MOVETO
L = Path.LINETO
kinds01 = [[M, L, L, L, M, L, L, L]]
cs = ContourSet(ax, [0, 1], [filled01], [kinds01], filled=True)
cbar = fig.colorbar(cs)

ax.set(xlim=(-0.5, 3.5), ylim=(-0.5, 3.5),
       title='User specified filled contours with holes')

plt.show()
Gesamtlaufzeit des Skripts: (0 Minuten 1,204 Sekunden)