Hinweis
Zum Ende springen, um den vollständigen Beispielcode herunterzuladen.
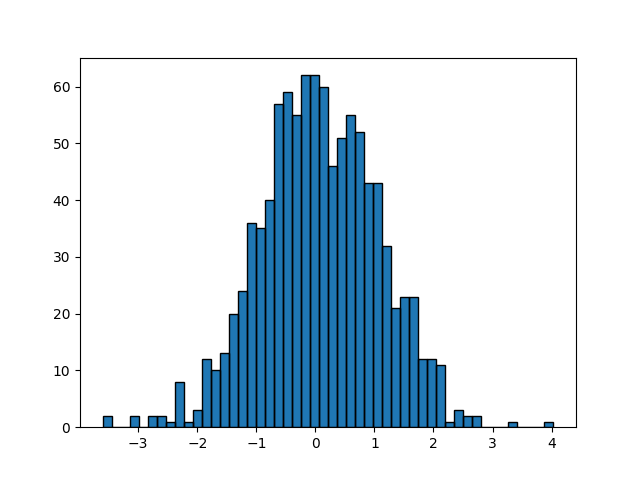
Erstellen von Histogrammen mit Rechtecken und PolyCollections#
Verwenden eines Pfad-Patches zum Zeichnen von Rechtecken.
Die Technik, viele Instanzen von Rectangle zu verwenden, oder die schnellere Methode mit PolyCollection, wurde implementiert, bevor wir in Matplotlib über richtige Pfade mit moveto, lineto, closepoly usw. verfügten. Da wir diese jetzt haben, können wir Sammlungen von regelmäßig geformten Objekten mit homogenen Eigenschaften effizienter mit einer PathCollection zeichnen. Dieses Beispiel erstellt ein Histogramm – es ist mehr Aufwand, die Vertex-Arrays von Anfang an einzurichten, aber es sollte für eine große Anzahl von Objekten viel schneller sein.
import matplotlib.pyplot as plt
import numpy as np

import matplotlib.patches as patches
import matplotlib.path as path

np.random.seed(19680801)  # Fixing random state for reproducibility

# histogram our data with numpy
data = np.random.randn(1000)
n, bins = np.histogram(data, 50)

# get the corners of the rectangles for the histogram
left = bins[:-1]
right = bins[1:]
bottom = np.zeros(len(left))
top = bottom + n

# we need a (numrects x numsides x 2) numpy array for the path helper
# function to build a compound path
XY = np.array([[left, left, right, right], [bottom, top, top, bottom]]).T

# get the Path object
barpath = path.Path.make_compound_path_from_polys(XY)

# make a patch out of it, don't add a margin at y=0
patch = patches.PathPatch(barpath)
patch.sticky_edges.y[:] = [0]

fig, ax = plt.subplots()
ax.add_patch(patch)
ax.autoscale_view()
plt.show()

Anstatt ein dreidimensionales Array zu erstellen und make_compound_path_from_polys zu verwenden, könnten wir den zusammengesetzten Pfad auch direkt mit Vertices und Codes erstellen, wie unten gezeigt wird.
nrects = len(left)
nverts = nrects*(1+3+1)
verts = np.zeros((nverts, 2))
codes = np.ones(nverts, int) * path.Path.LINETO
codes[0::5] = path.Path.MOVETO
codes[4::5] = path.Path.CLOSEPOLY
verts[0::5, 0] = left
verts[0::5, 1] = bottom
verts[1::5, 0] = left
verts[1::5, 1] = top
verts[2::5, 0] = right
verts[2::5, 1] = top
verts[3::5, 0] = right
verts[3::5, 1] = bottom

barpath = path.Path(verts, codes)

# make a patch out of it, don't add a margin at y=0
patch = patches.PathPatch(barpath)
patch.sticky_edges.y[:] = [0]

fig, ax = plt.subplots()
ax.add_patch(patch)
ax.autoscale_view()
plt.show()
Referenzen
Die Verwendung der folgenden Funktionen, Methoden, Klassen und Module wird in diesem Beispiel gezeigt
Dieses Beispiel zeigt eine Alternative zu