Hinweis
Zum Ende springen, um den vollständigen Beispielcode herunterzuladen.
Inset-Locator-Demo#
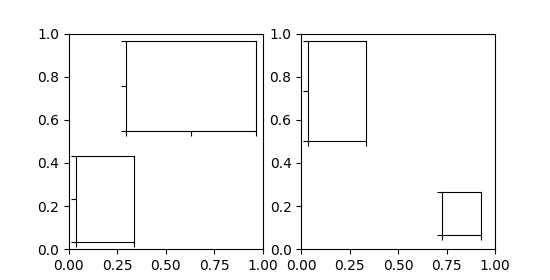
Die Funktion inset_locator's inset_axes ermöglicht das einfache Platzieren von Insets in den Ecken der Achsen, indem eine Breite und Höhe sowie optional eine Position (loc) angegeben werden, die Positionen als Codes akzeptiert, ähnlich wie bei legend. Standardmäßig ist der Inset einige Punkte vom Achsenbereich versetzt, gesteuert über den Parameter borderpad.
import matplotlib.pyplot as plt

from mpl_toolkits.axes_grid1.inset_locator import inset_axes

fig, (ax, ax2) = plt.subplots(1, 2, figsize=[5.5, 2.8])

# Create inset of width 1.3 inches and height 0.9 inches
# at the default upper right location.
axins = inset_axes(ax, width=1.3, height=0.9)

# Create inset of width 30% and height 40% of the parent Axes' bounding box
# at the lower left corner.
axins2 = inset_axes(ax, width="30%", height="40%", loc="lower left")

# Create inset of mixed specifications in the second subplot;
# width is 30% of parent Axes' bounding box and
# height is 1 inch at the upper left corner.
axins3 = inset_axes(ax2, width="30%", height=1., loc="upper left")

# Create an inset in the lower right corner with borderpad=1, i.e.
# 10 points padding (as 10pt is the default fontsize) to the parent Axes.
axins4 = inset_axes(ax2, width="20%", height="20%", loc="lower right", borderpad=1)

# Turn ticklabels of insets off
for axi in [axins, axins2, axins3, axins4]:
    axi.tick_params(labelleft=False, labelbottom=False)

plt.show()
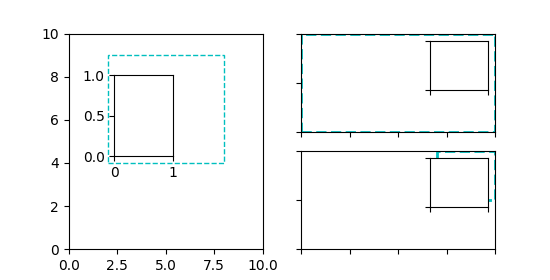
Die Parameter bbox_to_anchor und bbox_transform können für eine feinere Steuerung der Position und Größe des Insets verwendet werden oder sogar, um das Inset an völlig beliebigen Positionen zu platzieren. bbox_to_anchor setzt die Bounding Box in Koordinaten gemäß bbox_transform.
fig = plt.figure(figsize=[5.5, 2.8])
ax = fig.add_subplot(121)

# We use the Axes transform as bbox_transform. Therefore, the bounding box
# needs to be specified in axes coordinates ((0, 0) is the lower left corner
# of the Axes, (1, 1) is the upper right corner).
# The bounding box (.2, .4, .6, .5) starts at (.2, .4) and ranges to (.8, .9)
# in those coordinates.
# Inside this bounding box an inset of half the bounding box' width and
# three quarters of the bounding box' height is created. The lower left corner
# of the inset is aligned to the lower left corner of the bounding box.
# The inset is then offset by the default 0.5 in units of the font size.

axins = inset_axes(ax, width="50%", height="75%",
                   bbox_to_anchor=(.2, .4, .6, .5),
                   bbox_transform=ax.transAxes, loc="lower left")

# For visualization purposes we mark the bounding box by a rectangle
ax.add_patch(plt.Rectangle((.2, .4), .6, .5, ls="--", ec="c", fc="none",
                           transform=ax.transAxes))

# We set the axis limits to something other than the default, in order to not
# distract from the fact that axes coordinates are used here.
ax.set(xlim=(0, 10), ylim=(0, 10))


# Note how the two following insets are created at the same positions, one by
# use of the default parent Axes' bbox and the other via a bbox in Axes
# coordinates and the respective transform.
ax2 = fig.add_subplot(222)
axins2 = inset_axes(ax2, width="30%", height="50%")

ax3 = fig.add_subplot(224)
axins3 = inset_axes(ax3, width="100%", height="100%",
                    bbox_to_anchor=(.7, .5, .3, .5),
                    bbox_transform=ax3.transAxes)

# For visualization purposes we mark the bounding box by a rectangle
ax2.add_patch(plt.Rectangle((0, 0), 1, 1, ls="--", lw=2, ec="c", fc="none"))
ax3.add_patch(plt.Rectangle((.7, .5), .3, .5, ls="--", lw=2,
                            ec="c", fc="none"))

# Turn ticklabels off
for axi in [axins2, axins3, ax2, ax3]:
    axi.tick_params(labelleft=False, labelbottom=False)

plt.show()
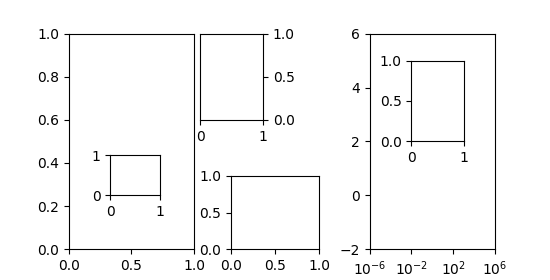
Im obigen Beispiel wurden die Achsentransformation zusammen mit 4-Tupel-Bounding-Boxen verwendet, da dies am nützlichsten ist, um einen Inset relativ zu den Achsen anzugeben, zu denen er gehört. Andere Anwendungsfälle sind jedoch ebenso möglich. Das folgende Beispiel untersucht einige davon.
fig = plt.figure(figsize=[5.5, 2.8])
ax = fig.add_subplot(131)

# Create an inset outside the Axes
axins = inset_axes(ax, width="100%", height="100%",
                   bbox_to_anchor=(1.05, .6, .5, .4),
                   bbox_transform=ax.transAxes, loc="upper left", borderpad=0)
axins.tick_params(left=False, right=True, labelleft=False, labelright=True)

# Create an inset with a 2-tuple bounding box. Note that this creates a
# bbox without extent. This hence only makes sense when specifying
# width and height in absolute units (inches).
axins2 = inset_axes(ax, width=0.5, height=0.4,
                    bbox_to_anchor=(0.33, 0.25),
                    bbox_transform=ax.transAxes, loc="lower left", borderpad=0)


ax2 = fig.add_subplot(133)
ax2.set_xscale("log")
ax2.set(xlim=(1e-6, 1e6), ylim=(-2, 6))

# Create inset in data coordinates using ax.transData as transform
axins3 = inset_axes(ax2, width="100%", height="100%",
                    bbox_to_anchor=(1e-2, 2, 1e3, 3),
                    bbox_transform=ax2.transData, loc="upper left", borderpad=0)

# Create an inset horizontally centered in figure coordinates and vertically
# bound to line up with the Axes.
from matplotlib.transforms import blended_transform_factory  # noqa

transform = blended_transform_factory(fig.transFigure, ax2.transAxes)
axins4 = inset_axes(ax2, width="16%", height="34%",
                    bbox_to_anchor=(0, 0, 1, 1),
                    bbox_transform=transform, loc="lower center", borderpad=0)

plt.show()
Gesamtlaufzeit des Skripts: (0 Minuten 1,732 Sekunden)