Hinweis
Zum Ende springen, um den vollständigen Beispielcode herunterzuladen.
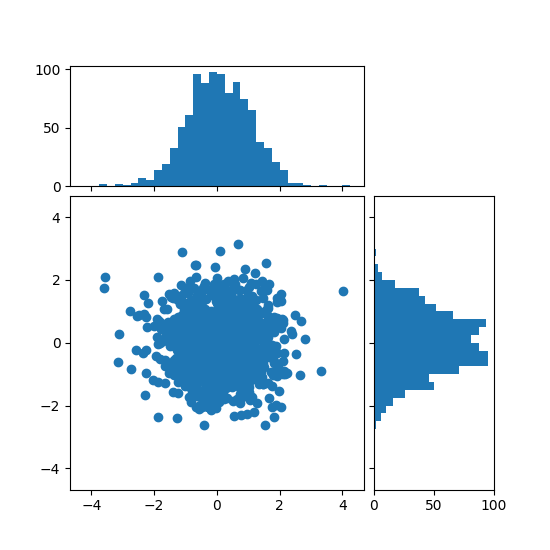
Histogramm mit lokalisierbaren Achsen an Streudiagramm ausrichten#
Randverteilungen eines Streudiagramms als Histogramme an den Seiten des Plots anzeigen.
Für eine gute Ausrichtung der Hauptachsen mit den Randverteilungen werden die Achsenpositionen durch einen Divider definiert, der über make_axes_locatable erzeugt wird. Beachten Sie, dass die Divider API das Festlegen von Achsengrößen und Abständen in Zoll ermöglicht, was ihr Hauptmerkmal ist.
Wenn man Achsengrößen und Abstände relativ zur Hauptfigur festlegen möchte, siehe das Beispiel Streudiagramm mit Histogrammen.
import matplotlib.pyplot as plt
import numpy as np

from mpl_toolkits.axes_grid1 import make_axes_locatable

# Fixing random state for reproducibility
np.random.seed(19680801)

# the random data
x = np.random.randn(1000)
y = np.random.randn(1000)


fig, ax = plt.subplots(figsize=(5.5, 5.5))

# the scatter plot:
ax.scatter(x, y)

# Set aspect of the main Axes.
ax.set_aspect(1.)

# create new Axes on the right and on the top of the current Axes
divider = make_axes_locatable(ax)
# below height and pad are in inches
ax_histx = divider.append_axes("top", 1.2, pad=0.1, sharex=ax)
ax_histy = divider.append_axes("right", 1.2, pad=0.1, sharey=ax)

# make some labels invisible
ax_histx.xaxis.set_tick_params(labelbottom=False)
ax_histy.yaxis.set_tick_params(labelleft=False)

# now determine nice limits by hand:
binwidth = 0.25
xymax = max(np.max(np.abs(x)), np.max(np.abs(y)))
lim = (int(xymax/binwidth) + 1)*binwidth

bins = np.arange(-lim, lim + binwidth, binwidth)
ax_histx.hist(x, bins=bins)
ax_histy.hist(y, bins=bins, orientation='horizontal')

# the xaxis of ax_histx and yaxis of ax_histy are shared with ax,
# thus there is no need to manually adjust the xlim and ylim of these
# axis.

ax_histx.set_yticks([0, 50, 100])
ax_histy.set_xticks([0, 50, 100])

plt.show()
Referenzen
Die Verwendung der folgenden Funktionen, Methoden, Klassen und Module wird in diesem Beispiel gezeigt