Hinweis
Gehen Sie zum Ende, um den vollständigen Beispielcode herunterzuladen.
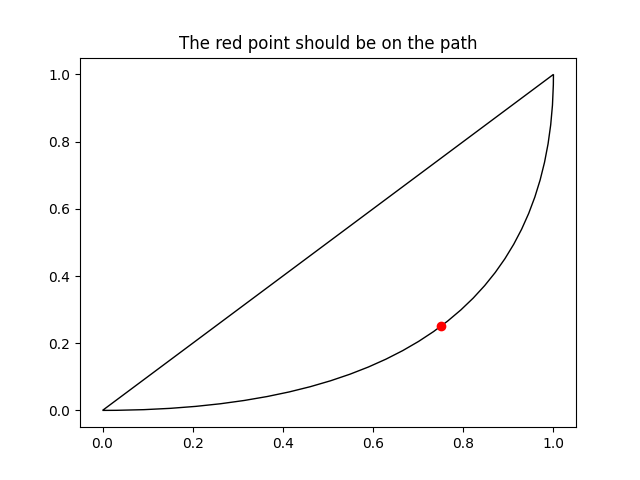
Bézier-Kurve#
Dieses Beispiel zeigt das Objekt PathPatch zur Erstellung eines Bézier-Polykurvenpfad-Patches.
import matplotlib.pyplot as plt

import matplotlib.patches as mpatches
import matplotlib.path as mpath

Path = mpath.Path

fig, ax = plt.subplots()
pp1 = mpatches.PathPatch(
    Path([(0, 0), (1, 0), (1, 1), (0, 0)],
         [Path.MOVETO, Path.CURVE3, Path.CURVE3, Path.CLOSEPOLY]),
    fc="none", transform=ax.transData)

ax.add_patch(pp1)
ax.plot([0.75], [0.25], "ro")
ax.set_title('The red point should be on the path')

plt.show()
Referenzen
Die Verwendung der folgenden Funktionen, Methoden, Klassen und Module wird in diesem Beispiel gezeigt