Hinweis
Gehen Sie zum Ende, um den vollständigen Beispielcode herunterzuladen.
Mehrere Unterdiagramme#
Einfache Demo mit mehreren Unterdiagrammen.
Weitere Optionen finden Sie unter Erstellen mehrerer Unterdiagramme mit plt.subplots.
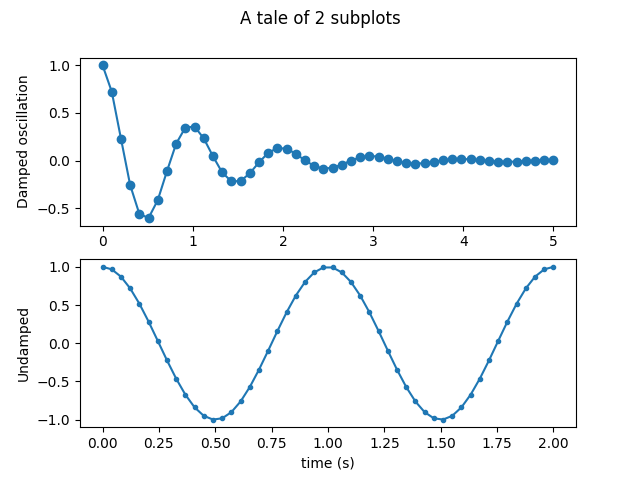
subplots() ist die empfohlene Methode, um einfache Unterdiagrammanordnungen zu generieren
fig, (ax1, ax2) = plt.subplots(2, 1)
fig.suptitle('A tale of 2 subplots')

ax1.plot(x1, y1, 'o-')
ax1.set_ylabel('Damped oscillation')

ax2.plot(x2, y2, '.-')
ax2.set_xlabel('time (s)')
ax2.set_ylabel('Undamped')

plt.show()
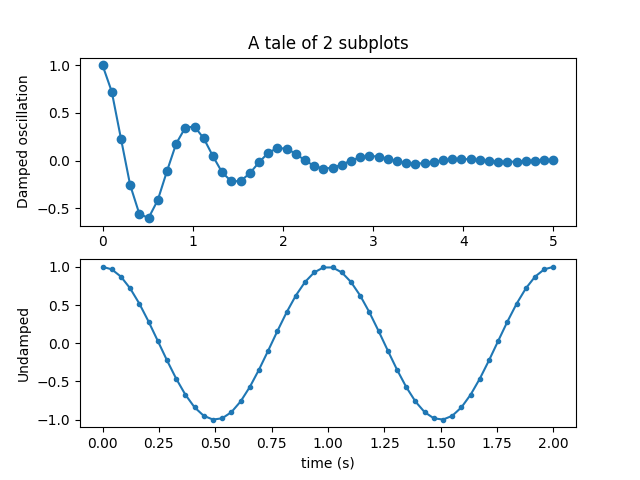
Unterdiagramme können auch einzeln mit subplot() generiert werden
plt.subplot(2, 1, 1)
plt.plot(x1, y1, 'o-')
plt.title('A tale of 2 subplots')
plt.ylabel('Damped oscillation')

plt.subplot(2, 1, 2)
plt.plot(x2, y2, '.-')
plt.xlabel('time (s)')
plt.ylabel('Undamped')

plt.show()
Gesamtlaufzeit des Skripts: (0 Minuten 1,943 Sekunden)