Hinweis
Zum Ende springen, um den vollständigen Beispielcode herunterzuladen.
Datumsachsen-Teiler und -Formatierer#
Dieses Beispiel veranschaulicht die Verwendung und Auswirkung der verschiedenen Datums-Teiler und -Formatierer.
import matplotlib.pyplot as plt
import numpy as np

from matplotlib.dates import (FR, MO, MONTHLY, SA, SU, TH, TU, WE,
                              AutoDateFormatter, AutoDateLocator,
                              ConciseDateFormatter, DateFormatter, DayLocator,
                              HourLocator, MicrosecondLocator, MinuteLocator,
                              MonthLocator, RRuleLocator, SecondLocator,
                              WeekdayLocator, YearLocator, rrulewrapper)
import matplotlib.ticker as ticker


def plot_axis(ax, locator=None, xmax='2002-02-01', fmt=None, formatter=None):
    """Set up common parameters for the Axes in the example."""
    ax.spines[['left', 'right', 'top']].set_visible(False)
    ax.yaxis.set_major_locator(ticker.NullLocator())
    ax.tick_params(which='major', width=1.00, length=5)
    ax.tick_params(which='minor', width=0.75, length=2.5)
    ax.set_xlim(np.datetime64('2000-02-01'), np.datetime64(xmax))
    if locator:
        ax.xaxis.set_major_locator(eval(locator))
        ax.xaxis.set_major_formatter(DateFormatter(fmt))
    else:
        ax.xaxis.set_major_formatter(eval(formatter))
    ax.text(0.0, 0.2, locator or formatter, transform=ax.transAxes,
            fontsize=14, fontname='Monospace', color='tab:blue')
Datumsachsen-Teiler#
locators = [
    # locator as str, xmax, fmt
    ('AutoDateLocator(maxticks=8)', '2003-02-01', '%Y-%m'),
    ('YearLocator(month=4)', '2003-02-01', '%Y-%m'),
    ('MonthLocator(bymonth=[4, 8, 12])', '2003-02-01', '%Y-%m'),
    ('DayLocator(interval=180)', '2003-02-01', '%Y-%m-%d'),
    ('WeekdayLocator(byweekday=SU, interval=4)', '2000-07-01', '%a %Y-%m-%d'),
    ('HourLocator(byhour=range(0, 24, 6))', '2000-02-04', '%H h'),
    ('MinuteLocator(interval=15)', '2000-02-01 02:00', '%H:%M'),
    ('SecondLocator(bysecond=(0, 30))', '2000-02-01 00:02', '%H:%M:%S'),
    ('MicrosecondLocator(interval=1000)', '2000-02-01 00:00:00.005', '%S.%f'),
    ('RRuleLocator(rrulewrapper(freq=MONTHLY, \nbyweekday=(MO, TU, WE, TH, FR), '
     'bysetpos=-1))', '2000-07-01', '%Y-%m-%d'),
]

fig, axs = plt.subplots(len(locators), 1, figsize=(8, len(locators) * .8),
                        layout='constrained')
fig.suptitle('Date Locators')
for ax, (locator, xmax, fmt) in zip(axs, locators):
    plot_axis(ax, locator, xmax, fmt)

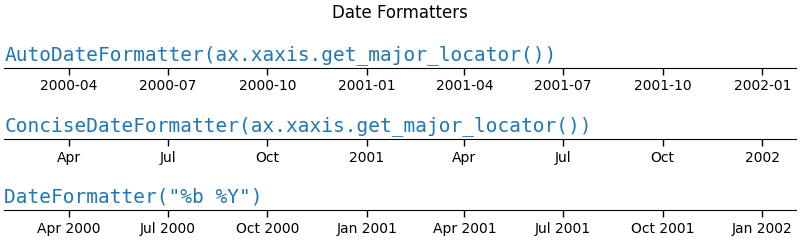
Datumsachsen-Formatierer#
formatters = [
    'AutoDateFormatter(ax.xaxis.get_major_locator())',
    'ConciseDateFormatter(ax.xaxis.get_major_locator())',
    'DateFormatter("%b %Y")',
]

fig, axs = plt.subplots(len(formatters), 1, figsize=(8, len(formatters) * .8),
                        layout='constrained')
fig.suptitle('Date Formatters')
for ax, fmt in zip(axs, formatters):
    plot_axis(ax, formatter=fmt)
Referenzen
Die Verwendung der folgenden Funktionen, Methoden, Klassen und Module wird in diesem Beispiel gezeigt
Gesamtlaufzeit des Skripts: (0 Minuten 3,786 Sekunden)