Hinweis
Zum Ende springen, um den vollständigen Beispielcode herunterzuladen.
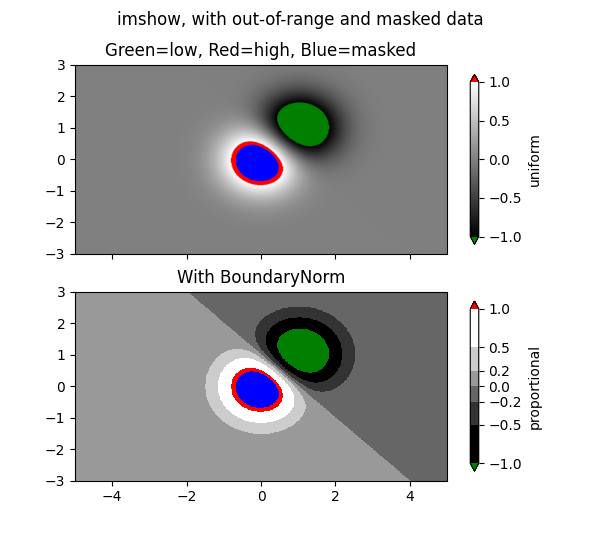
Bild mit maskierten Werten#
imshow mit maskiertem Array-Input und Farben außerhalb des Bereichs.
Das zweite Unterdiagramm illustriert die Verwendung von BoundaryNorm, um einen gefüllten Kontureffekt zu erzielen.
import matplotlib.pyplot as plt
import numpy as np

import matplotlib.colors as colors

# compute some interesting data
x0, x1 = -5, 5
y0, y1 = -3, 3
x = np.linspace(x0, x1, 500)
y = np.linspace(y0, y1, 500)
X, Y = np.meshgrid(x, y)
Z1 = np.exp(-X**2 - Y**2)
Z2 = np.exp(-(X - 1)**2 - (Y - 1)**2)
Z = (Z1 - Z2) * 2

# Set up a colormap:
palette = plt.cm.gray.with_extremes(over='r', under='g', bad='b')
# Alternatively, we could use
# palette.set_bad(alpha = 0.0)
# to make the bad region transparent.  This is the default.
# If you comment out all the palette.set* lines, you will see
# all the defaults; under and over will be colored with the
# first and last colors in the palette, respectively.
Zm = np.ma.masked_where(Z > 1.2, Z)

# By setting vmin and vmax in the norm, we establish the
# range to which the regular palette color scale is applied.
# Anything above that range is colored based on palette.set_over, etc.

# set up the Axes objects
fig, (ax1, ax2) = plt.subplots(nrows=2, figsize=(6, 5.4))

# plot using 'continuous' colormap
im = ax1.imshow(Zm, interpolation='bilinear',
                cmap=palette,
                norm=colors.Normalize(vmin=-1.0, vmax=1.0),
                aspect='auto',
                origin='lower',
                extent=[x0, x1, y0, y1])
ax1.set_title('Green=low, Red=high, Blue=masked')
cbar = fig.colorbar(im, extend='both', shrink=0.9, ax=ax1)
cbar.set_label('uniform')
ax1.tick_params(axis='x', labelbottom=False)

# Plot using a small number of colors, with unevenly spaced boundaries.
im = ax2.imshow(Zm, interpolation='nearest',
                cmap=palette,
                norm=colors.BoundaryNorm([-1, -0.5, -0.2, 0, 0.2, 0.5, 1],
                                         ncolors=palette.N),
                aspect='auto',
                origin='lower',
                extent=[x0, x1, y0, y1])
ax2.set_title('With BoundaryNorm')
cbar = fig.colorbar(im, extend='both', spacing='proportional',
                    shrink=0.9, ax=ax2)
cbar.set_label('proportional')

fig.suptitle('imshow, with out-of-range and masked data')
plt.show()
Referenzen
Die Verwendung der folgenden Funktionen, Methoden, Klassen und Module wird in diesem Beispiel gezeigt
Gesamte Laufzeit des Skripts: (0 Minuten 1,438 Sekunden)