Hinweis
Zum Ende springen, um den vollständigen Beispielcode herunterzuladen.
Liste benannter Farben#
Dies plottet eine Liste der von Matplotlib unterstützten benannten Farben. Weitere Informationen zu Farben in Matplotlib finden Sie im
Tutorial Farben angeben;
der
matplotlib.colorsAPI;der Farb-Demo.
Hilfsfunktion zum Plotten#
Zuerst definieren wir eine Hilfsfunktion zum Erstellen einer Tabelle von Farben, die wir dann für einige gängige Farbkategorien verwenden.
import math

import matplotlib.pyplot as plt

import matplotlib.colors as mcolors
from matplotlib.patches import Rectangle


def plot_colortable(colors, *, ncols=4, sort_colors=True):

    cell_width = 212
    cell_height = 22
    swatch_width = 48
    margin = 12

    # Sort colors by hue, saturation, value and name.
    if sort_colors is True:
        names = sorted(
            colors, key=lambda c: tuple(mcolors.rgb_to_hsv(mcolors.to_rgb(c))))
    else:
        names = list(colors)

    n = len(names)
    nrows = math.ceil(n / ncols)

    width = cell_width * ncols + 2 * margin
    height = cell_height * nrows + 2 * margin
    dpi = 72

    fig, ax = plt.subplots(figsize=(width / dpi, height / dpi), dpi=dpi)
    fig.subplots_adjust(margin/width, margin/height,
                        (width-margin)/width, (height-margin)/height)
    ax.set_xlim(0, cell_width * ncols)
    ax.set_ylim(cell_height * (nrows-0.5), -cell_height/2.)
    ax.yaxis.set_visible(False)
    ax.xaxis.set_visible(False)
    ax.set_axis_off()

    for i, name in enumerate(names):
        row = i % nrows
        col = i // nrows
        y = row * cell_height

        swatch_start_x = cell_width * col
        text_pos_x = cell_width * col + swatch_width + 7

        ax.text(text_pos_x, y, name, fontsize=14,
                horizontalalignment='left',
                verticalalignment='center')

        ax.add_patch(
            Rectangle(xy=(swatch_start_x, y-9), width=swatch_width,
                      height=18, facecolor=colors[name], edgecolor='0.7')
        )

    return fig
Basisfarben#
plot_colortable(mcolors.BASE_COLORS, ncols=3, sort_colors=False)
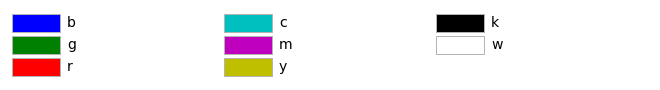
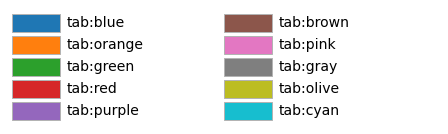
Tableau-Palette#
plot_colortable(mcolors.TABLEAU_COLORS, ncols=2, sort_colors=False)
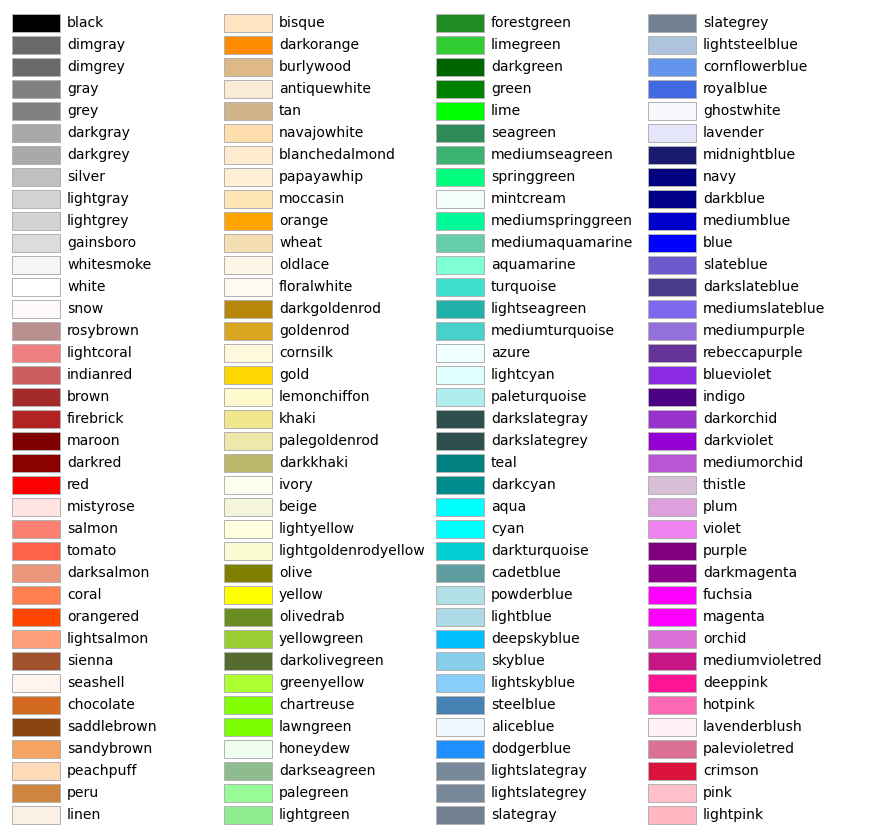
CSS-Farben#
plot_colortable(mcolors.CSS4_COLORS)
plt.show()
XKCD-Farben#
Matplotlib unterstützt Farben aus der xkcd-Farbumfrage, z. B. "xkcd:sky blue". Da diese fast 1000 Farben enthält, wäre eine Abbildung davon sehr groß und wird daher hier weggelassen. Sie können den folgenden Code verwenden, um die Übersicht selbst zu generieren
xkcd_fig = plot_colortable(mcolors.XKCD_COLORS)
xkcd_fig.savefig("XKCD_Colors.png")
Referenzen
Die Verwendung der folgenden Funktionen, Methoden, Klassen und Module wird in diesem Beispiel gezeigt
Gesamtlaufzeit des Skripts: (0 Minuten 1,716 Sekunden)