Hinweis
Zum Ende springen, um den vollständigen Beispielcode herunterzuladen.
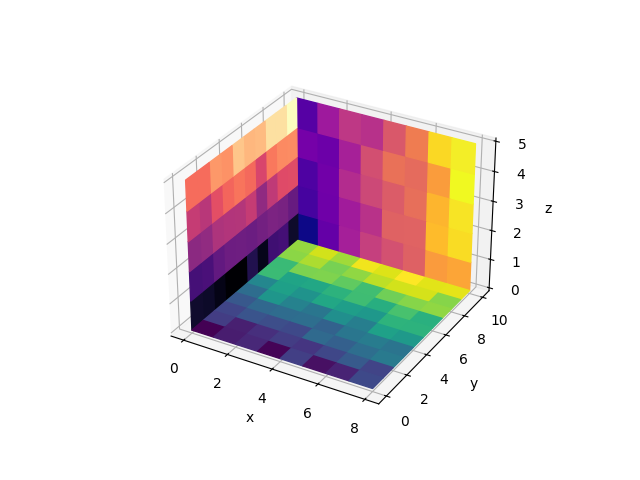
2D-Bilder in 3D#
Dieses Beispiel zeigt, wie 2D-farbcodierte Bilder (ähnlich wie bei Axes.imshow) als Ebene in 3D gezeichnet werden.
Matplotlib hat keine native Funktion dafür. Unten erstellen wir eine, indem wir uns auf Axes3D.plot_surface verlassen. Der Einfachheit halber gibt es einige Unterschiede zu Axes.imshow: Diese Funktion setzt das Seitenverhältnis der Achsen nicht, daher sind Pixel nicht notwendigerweise quadratisch. Außerdem liegen Pixelkanten auf ganzzahligen Werten und nicht auf Pixelzentren. Darüber hinaus sind viele optionale Parameter von Axes.imshow nicht implementiert.
Mehrere Aufrufe von imshow3d verwenden standardmäßig unabhängige Normen und somit unterschiedliche Farbskalen. Wenn Sie eine einzelne gemeinsame Farbskala wünschen, müssen Sie vorher eine geeignete Norm konstruieren und diese an alle imshow3d -Aufrufe übergeben.
Eine grundlegende Einschränkung der 3D-Plotting-Engine besteht darin, dass sich schneidende Objekte nicht korrekt gezeichnet werden können. Ein Objekt wird immer nach dem anderen gezeichnet. Daher können mehrere Ebenen im Hintergrund gut verwendet werden, wie in diesem Beispiel gezeigt. Dieser Ansatz ist jedoch nicht geeignet, wenn sich die Ebenen schneiden.
import matplotlib.pyplot as plt
import numpy as np

from matplotlib.colors import Normalize


def imshow3d(ax, array, value_direction='z', pos=0, norm=None, cmap=None):
    """
    Display a 2D array as a  color-coded 2D image embedded in 3d.

    The image will be in a plane perpendicular to the coordinate axis *value_direction*.

    Parameters
    ----------
    ax : Axes3D
        The 3D Axes to plot into.
    array : 2D numpy array
        The image values.
    value_direction : {'x', 'y', 'z'}
        The axis normal to the image plane.
    pos : float
        The numeric value on the *value_direction* axis at which the image plane is
        located.
    norm : `~matplotlib.colors.Normalize`, default: Normalize
        The normalization method used to scale scalar data. See `imshow()`.
    cmap : str or `~matplotlib.colors.Colormap`, default: :rc:`image.cmap`
        The Colormap instance or registered colormap name used to map scalar data
        to colors.
    """
    if norm is None:
        norm = Normalize()
    colors = plt.get_cmap(cmap)(norm(array))

    if value_direction == 'x':
        nz, ny = array.shape
        zi, yi = np.mgrid[0:nz + 1, 0:ny + 1]
        xi = np.full_like(yi, pos)
    elif value_direction == 'y':
        nx, nz = array.shape
        xi, zi = np.mgrid[0:nx + 1, 0:nz + 1]
        yi = np.full_like(zi, pos)
    elif value_direction == 'z':
        ny, nx = array.shape
        yi, xi = np.mgrid[0:ny + 1, 0:nx + 1]
        zi = np.full_like(xi, pos)
    else:
        raise ValueError(f"Invalid value_direction: {value_direction!r}")
    ax.plot_surface(xi, yi, zi, rstride=1, cstride=1, facecolors=colors, shade=False)


fig = plt.figure()
ax = fig.add_subplot(projection='3d')
ax.set(xlabel="x", ylabel="y", zlabel="z")

nx, ny, nz = 8, 10, 5
data_xy = np.arange(ny * nx).reshape(ny, nx) + 15 * np.random.random((ny, nx))
data_yz = np.arange(nz * ny).reshape(nz, ny) + 10 * np.random.random((nz, ny))
data_zx = np.arange(nx * nz).reshape(nx, nz) + 8 * np.random.random((nx, nz))

imshow3d(ax, data_xy)
imshow3d(ax, data_yz, value_direction='x', cmap='magma')
imshow3d(ax, data_zx, value_direction='y', pos=ny, cmap='plasma')

plt.show()
Gesamtlaufzeit des Skripts: (0 Minuten 1,003 Sekunden)