Hinweis
Gehen Sie zum Ende, um den vollständigen Beispielcode herunterzuladen.
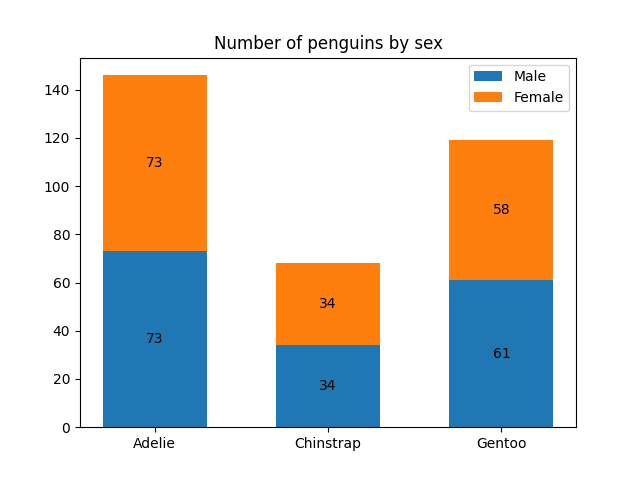
Balkendiagramm mit Beschriftungen#
Dieses Beispiel zeigt, wie die Hilfsfunktion bar_label verwendet wird, um Beschriftungen für Balkendiagramme zu erstellen.
Siehe auch die Beispiele Gruppiertes Balkendiagramm, Gestapeltes Balkendiagramm und Horizontales Balkendiagramm.
import matplotlib.pyplot as plt
import numpy as np
Daten von https://allisonhorst.github.io/palmerpenguins/
species = ('Adelie', 'Chinstrap', 'Gentoo')
sex_counts = {
    'Male': np.array([73, 34, 61]),
    'Female': np.array([73, 34, 58]),
}
width = 0.6  # the width of the bars: can also be len(x) sequence


fig, ax = plt.subplots()
bottom = np.zeros(3)

for sex, sex_count in sex_counts.items():
    p = ax.bar(species, sex_count, width, label=sex, bottom=bottom)
    bottom += sex_count

    ax.bar_label(p, label_type='center')

ax.set_title('Number of penguins by sex')
ax.legend()

plt.show()
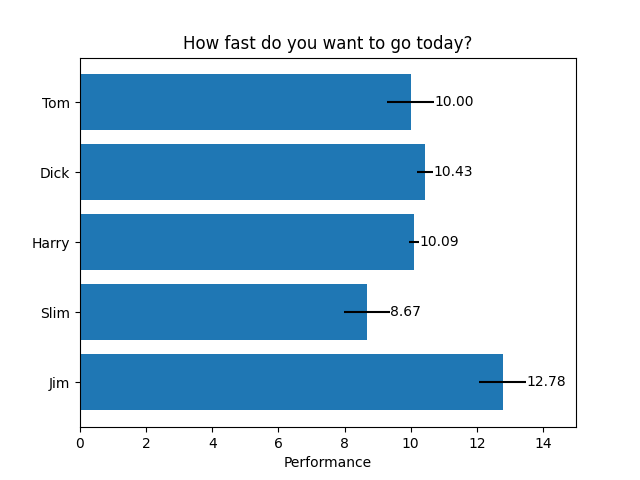
Horizontales Balkendiagramm
# Fixing random state for reproducibility
np.random.seed(19680801)

# Example data
people = ('Tom', 'Dick', 'Harry', 'Slim', 'Jim')
y_pos = np.arange(len(people))
performance = 3 + 10 * np.random.rand(len(people))
error = np.random.rand(len(people))

fig, ax = plt.subplots()

hbars = ax.barh(y_pos, performance, xerr=error, align='center')
ax.set_yticks(y_pos, labels=people)
ax.invert_yaxis()  # labels read top-to-bottom
ax.set_xlabel('Performance')
ax.set_title('How fast do you want to go today?')

# Label with specially formatted floats
ax.bar_label(hbars, fmt='%.2f')
ax.set_xlim(right=15)  # adjust xlim to fit labels

plt.show()
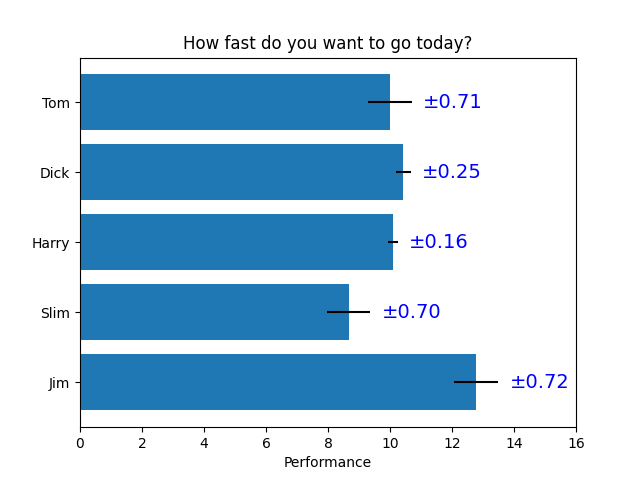
Einige der fortgeschritteneren Dinge, die man mit Balkenbeschriftungen machen kann
fig, ax = plt.subplots()

hbars = ax.barh(y_pos, performance, xerr=error, align='center')
ax.set_yticks(y_pos, labels=people)
ax.invert_yaxis()  # labels read top-to-bottom
ax.set_xlabel('Performance')
ax.set_title('How fast do you want to go today?')

# Label with given captions, custom padding and annotate options
ax.bar_label(hbars, labels=[f'±{e:.2f}' for e in error],
             padding=8, color='b', fontsize=14)
ax.set_xlim(right=16)

plt.show()
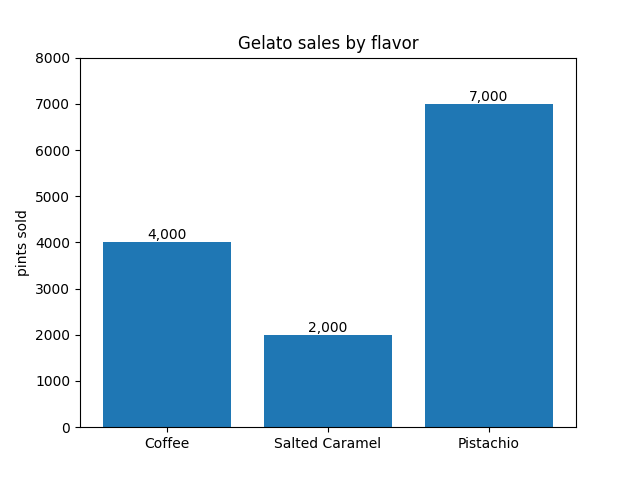
Balkenbeschriftungen mit {} Stil-Formatierungszeichenfolge
fruit_names = ['Coffee', 'Salted Caramel', 'Pistachio']
fruit_counts = [4000, 2000, 7000]

fig, ax = plt.subplots()
bar_container = ax.bar(fruit_names, fruit_counts)
ax.set(ylabel='pints sold', title='Gelato sales by flavor', ylim=(0, 8000))
ax.bar_label(bar_container, fmt='{:,.0f}')
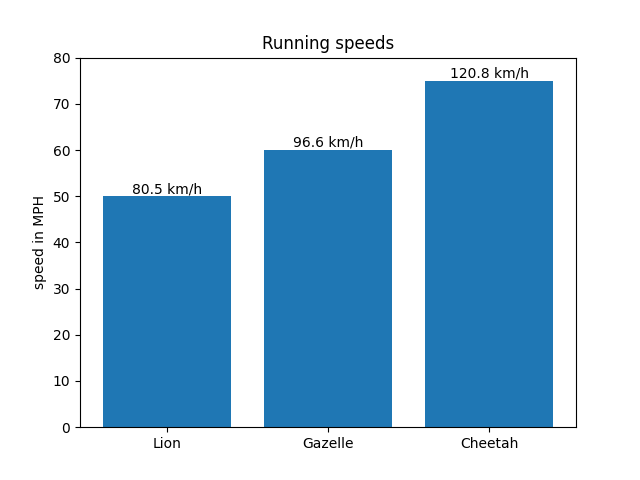
Balkenbeschriftungen mit einer aufrufbaren Funktion
animal_names = ['Lion', 'Gazelle', 'Cheetah']
mph_speed = [50, 60, 75]

fig, ax = plt.subplots()
bar_container = ax.bar(animal_names, mph_speed)
ax.set(ylabel='speed in MPH', title='Running speeds', ylim=(0, 80))
ax.bar_label(bar_container, fmt=lambda x: f'{x * 1.61:.1f} km/h')
Referenzen
Die Verwendung der folgenden Funktionen, Methoden, Klassen und Module wird in diesem Beispiel gezeigt
Gesamtlaufzeit des Skripts: (0 Minuten 3,041 Sekunden)