Hinweis
Gehen Sie zum Ende, um den vollständigen Beispielcode herunterzuladen.
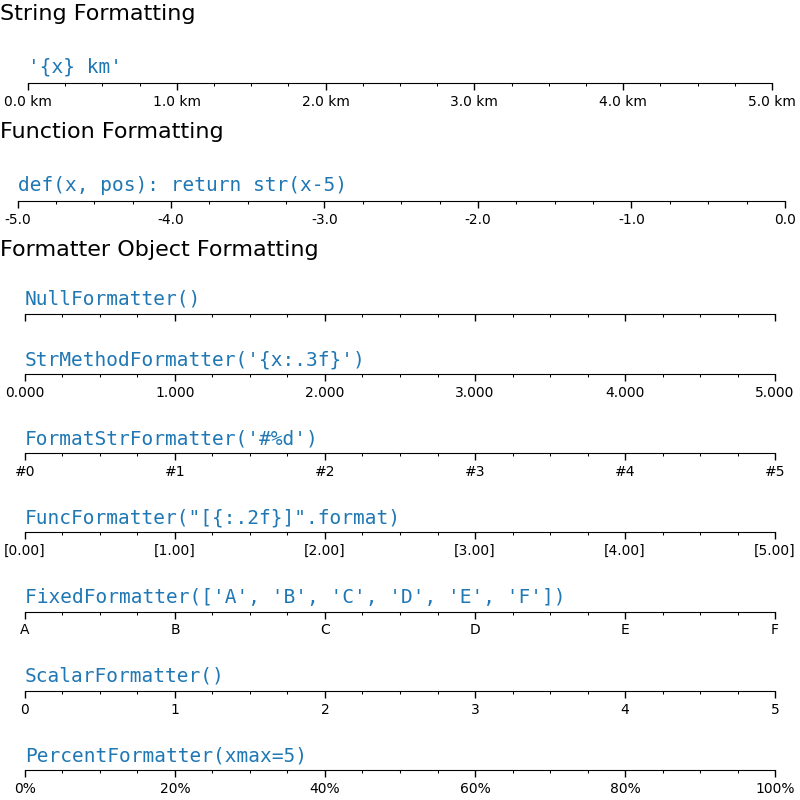
Tick-Formatierer#
Tick-Formatierer definieren, wie der numerische Wert, der mit einem Tick auf einer Achse verbunden ist, als Zeichenkette formatiert wird.
Dieses Beispiel illustriert die Verwendung und Auswirkung der gängigsten Formatierer.
Das Tick-Format wird über die Funktion set_major_formatter oder set_minor_formatter konfiguriert. Sie akzeptiert
eine Formatzeichenkette, die implizit einen
StrMethodFormattererstellt.eine Funktion, die implizit einen
FuncFormattererstellt.eine Instanz einer Unterklasse von
Formatter. Die gängigsten sindNullFormatter: Keine Beschriftungen an den Ticks.StrMethodFormatter: Verwendet diestr.format-Methode der Zeichenkette.FormatStrFormatter: Verwendet die %-Formatierung.FuncFormatter: Definiert Beschriftungen durch eine Funktion.FixedFormatter: Setzt die Beschriftungszeichenketten explizit.ScalarFormatter: Standard-Formatierer für Skalare: wählt die Formatzeichenkette automatisch aus.PercentFormatter: Formatiert Beschriftungen als Prozentzahl.
Eine vollständige Liste finden Sie unter Tick-Formatierung.
import matplotlib.pyplot as plt

from matplotlib import ticker


def setup(ax, title):
    """Set up common parameters for the Axes in the example."""
    # only show the bottom spine
    ax.yaxis.set_major_locator(ticker.NullLocator())
    ax.spines[['left', 'right', 'top']].set_visible(False)

    # define tick positions
    ax.xaxis.set_major_locator(ticker.MultipleLocator(1.00))
    ax.xaxis.set_minor_locator(ticker.MultipleLocator(0.25))

    ax.xaxis.set_ticks_position('bottom')
    ax.tick_params(which='major', width=1.00, length=5)
    ax.tick_params(which='minor', width=0.75, length=2.5, labelsize=10)
    ax.set_xlim(0, 5)
    ax.set_ylim(0, 1)
    ax.text(0.0, 0.2, title, transform=ax.transAxes,
            fontsize=14, fontname='Monospace', color='tab:blue')


fig = plt.figure(figsize=(8, 8), layout='constrained')
fig0, fig1, fig2 = fig.subfigures(3, height_ratios=[1.5, 1.5, 7.5])

fig0.suptitle('String Formatting', fontsize=16, x=0, ha='left')
ax0 = fig0.subplots()

setup(ax0, title="'{x} km'")
ax0.xaxis.set_major_formatter('{x} km')


fig1.suptitle('Function Formatting', fontsize=16, x=0, ha='left')
ax1 = fig1.subplots()

setup(ax1, title="def(x, pos): return str(x-5)")
ax1.xaxis.set_major_formatter(lambda x, pos: str(x-5))


fig2.suptitle('Formatter Object Formatting', fontsize=16, x=0, ha='left')
axs2 = fig2.subplots(7, 1)

setup(axs2[0], title="NullFormatter()")
axs2[0].xaxis.set_major_formatter(ticker.NullFormatter())

setup(axs2[1], title="StrMethodFormatter('{x:.3f}')")
axs2[1].xaxis.set_major_formatter(ticker.StrMethodFormatter("{x:.3f}"))

setup(axs2[2], title="FormatStrFormatter('#%d')")
axs2[2].xaxis.set_major_formatter(ticker.FormatStrFormatter("#%d"))


def fmt_two_digits(x, pos):
    return f'[{x:.2f}]'


setup(axs2[3], title='FuncFormatter("[{:.2f}]".format)')
axs2[3].xaxis.set_major_formatter(ticker.FuncFormatter(fmt_two_digits))

setup(axs2[4], title="FixedFormatter(['A', 'B', 'C', 'D', 'E', 'F'])")
# FixedFormatter should only be used together with FixedLocator.
# Otherwise, one cannot be sure where the labels will end up.
positions = [0, 1, 2, 3, 4, 5]
labels = ['A', 'B', 'C', 'D', 'E', 'F']
axs2[4].xaxis.set_major_locator(ticker.FixedLocator(positions))
axs2[4].xaxis.set_major_formatter(ticker.FixedFormatter(labels))

setup(axs2[5], title="ScalarFormatter()")
axs2[5].xaxis.set_major_formatter(ticker.ScalarFormatter(useMathText=True))

setup(axs2[6], title="PercentFormatter(xmax=5)")
axs2[6].xaxis.set_major_formatter(ticker.PercentFormatter(xmax=5))

plt.show()
Gesamtlaufzeit des Skripts: (0 Minuten 2,440 Sekunden)