Hinweis
Gehen Sie zum Ende, um den vollständigen Beispielcode herunterzuladen.
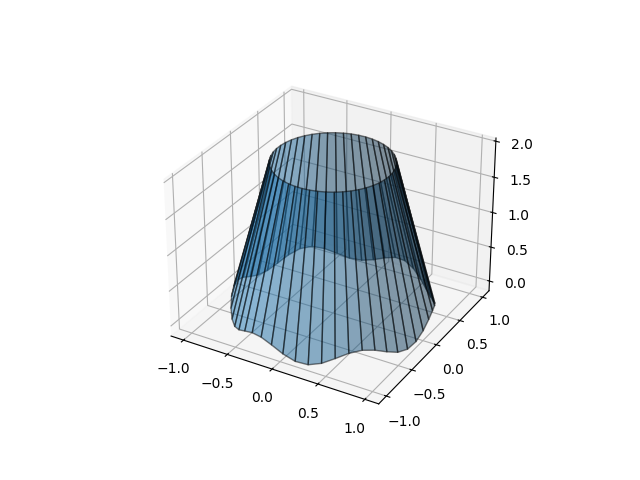
Zwischen 3D-Linien füllen#
Demonstrieren Sie, wie der Raum zwischen 3D-Linien mit Flächen gefüllt wird. Hier erstellen wir eine Art "Lampenschirm"-Form.
import matplotlib.pyplot as plt
import numpy as np

N = 50
theta = np.linspace(0, 2*np.pi, N)

x1 = np.cos(theta)
y1 = np.sin(theta)
z1 = 0.1 * np.sin(6 * theta)

x2 = 0.6 * np.cos(theta)
y2 = 0.6 * np.sin(theta)
z2 = 2  # Note that scalar values work in addition to length N arrays

fig = plt.figure()
ax = fig.add_subplot(projection='3d')
ax.fill_between(x1, y1, z1, x2, y2, z2, alpha=0.5, edgecolor='k')

plt.show()
Gesamtlaufzeit des Skripts: (0 Minuten 1,043 Sekunden)