Hinweis
Zum Ende springen, um den vollständigen Beispielcode herunterzuladen.
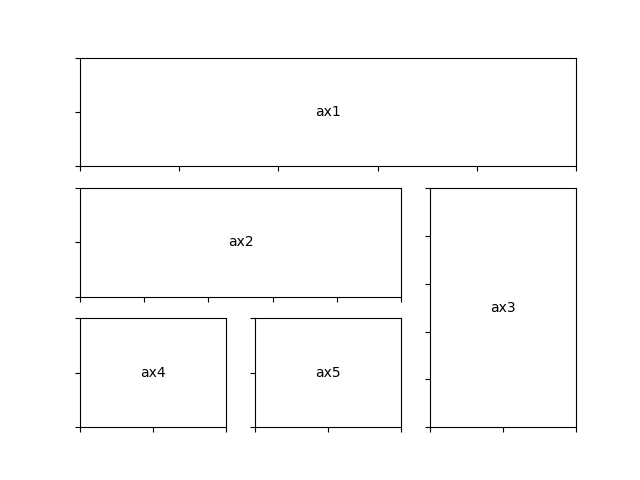
subplot2grid#
Dieses Beispiel demonstriert die Verwendung von pyplot.subplot2grid zur Erzeugung von Unterdiagrammen. Die Verwendung von GridSpec, wie in GridSpec mit variablen Größen und Abständen demonstriert, wird generell bevorzugt.
import matplotlib.pyplot as plt


def annotate_axes(fig):
    for i, ax in enumerate(fig.axes):
        ax.text(0.5, 0.5, "ax%d" % (i+1), va="center", ha="center")
        ax.tick_params(labelbottom=False, labelleft=False)


fig = plt.figure()
ax1 = plt.subplot2grid((3, 3), (0, 0), colspan=3)
ax2 = plt.subplot2grid((3, 3), (1, 0), colspan=2)
ax3 = plt.subplot2grid((3, 3), (1, 2), rowspan=2)
ax4 = plt.subplot2grid((3, 3), (2, 0))
ax5 = plt.subplot2grid((3, 3), (2, 1))

annotate_axes(fig)

plt.show()