Hinweis
Zum Ende springen, um den vollständigen Beispielcode herunterzuladen.
Mehrere Linien mit einer LineCollection plotten#
Matplotlib kann mehrere Linien gleichzeitig effizient mit einer LineCollection zeichnen.
import matplotlib.pyplot as plt
import numpy as np
from matplotlib.collections import LineCollection
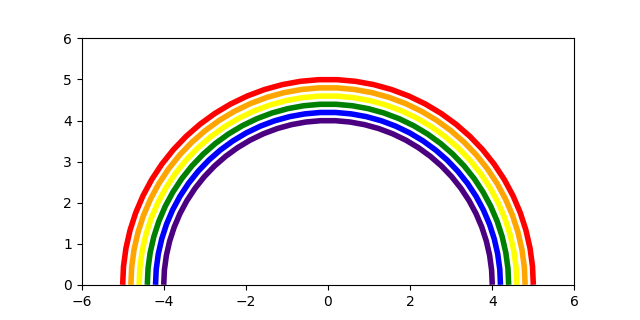
colors = ["indigo", "blue", "green", "yellow", "orange", "red"]
# create a list of half-circles with varying radii
theta = np.linspace(0, np.pi, 36)
radii = np.linspace(4, 5, num=len(colors))
arcs = [np.column_stack([r * np.cos(theta), r * np.sin(theta)]) for r in radii]
fig, ax = plt.subplots(figsize=(6.4, 3.2))
# set axes limits manually because Collections do not take part in autoscaling
ax.set_xlim(-6, 6)
ax.set_ylim(0, 6)
ax.set_aspect("equal") # to make the arcs look circular
# create a LineCollection with the half-circles
# its properties can be set per line by passing a sequence (here used for *colors*)
# or they can be set for all lines by passing a scalar (here used for *linewidths*)
line_collection = LineCollection(arcs, colors=colors, linewidths=4)
ax.add_collection(line_collection)
plt.show()
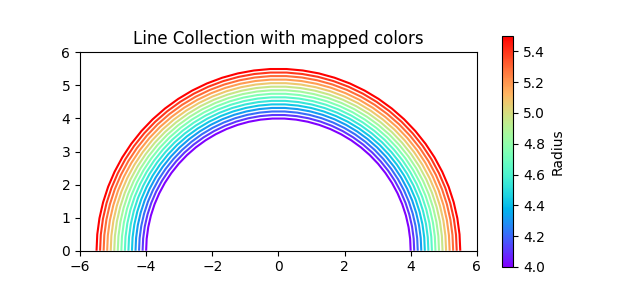
Anstatt eine Liste von Farben zu übergeben (colors=colors), können wir alternativ Colormapping verwenden. Die Linien werden dann basierend auf einem zusätzlichen Array von Werten, das an den Parameter array übergeben wird, farblich kodiert. Im folgenden Beispiel färben wir die Linien basierend auf ihrem Radius, indem wir array=radii übergeben.
num_arcs = 15
theta = np.linspace(0, np.pi, 36)
radii = np.linspace(4, 5.5, num=num_arcs)
arcs = [np.column_stack([r * np.cos(theta), r * np.sin(theta)]) for r in radii]

fig, ax = plt.subplots(figsize=(6.4, 3))
# set axes limits manually because Collections do not take part in autoscaling
ax.set_xlim(-6, 6)
ax.set_ylim(0, 6)
ax.set_aspect("equal")  # to make the arcs look circular

# create a LineCollection with the half-circles and color mapping
line_collection = LineCollection(arcs, array=radii, cmap="rainbow")
ax.add_collection(line_collection)

fig.colorbar(line_collection, label="Radius")
ax.set_title("Line Collection with mapped colors")

plt.show()
Referenzen
Die Verwendung der folgenden Funktionen, Methoden, Klassen und Module wird in diesem Beispiel gezeigt
Gesamtlaufzeit des Skripts: (0 Minuten 1,319 Sekunden)