Hinweis
Zum Ende springen, um den vollständigen Beispielcode herunterzuladen.
Geografische Projektionen#
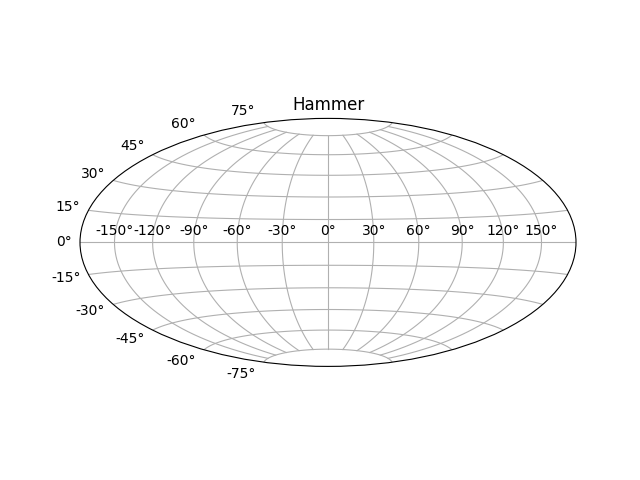
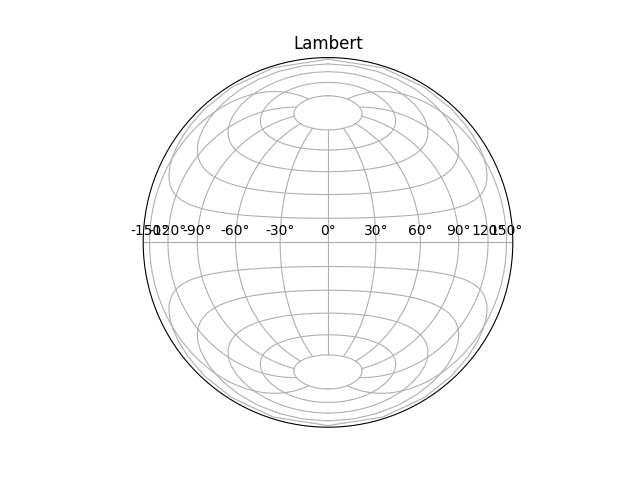
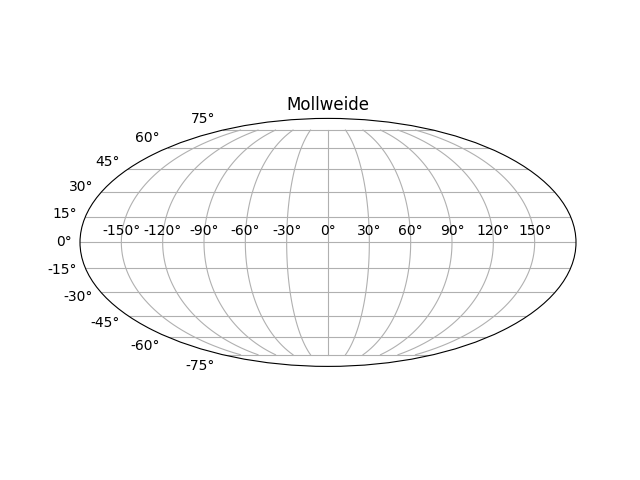
Dies zeigt 4 mögliche geografische Projektionen. Cartopy unterstützt weitere Projektionen.
import matplotlib.pyplot as plt
plt.figure()
plt.subplot(projection="aitoff")
plt.title("Aitoff")
plt.grid(True)

plt.figure()
plt.subplot(projection="hammer")
plt.title("Hammer")
plt.grid(True)
plt.figure()
plt.subplot(projection="lambert")
plt.title("Lambert")
plt.grid(True)
plt.figure()
plt.subplot(projection="mollweide")
plt.title("Mollweide")
plt.grid(True)

plt.show()
Gesamte Laufzeit des Skripts: (0 Minuten 2,749 Sekunden)