Hinweis
Zum Ende springen, um den vollständigen Beispielcode herunterzuladen.
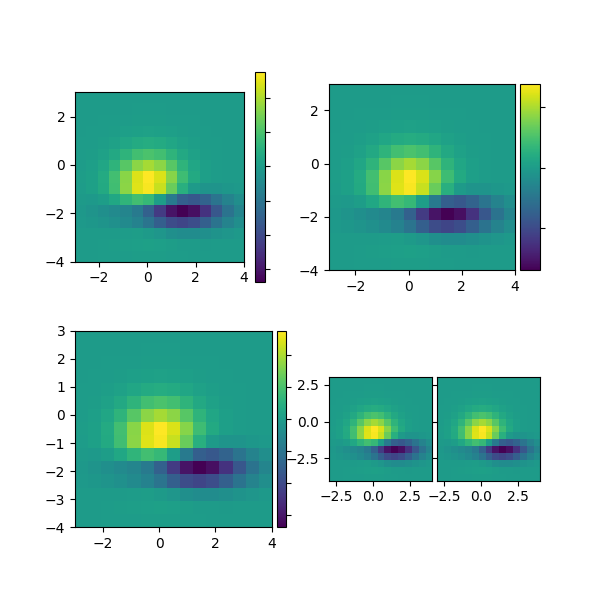
Achsen-Teiler#
Achsen-Teiler zur Berechnung der Position von Achsen und zur Erstellung eines Teilers für diese unter Verwendung vorhandener Achseninstanzen.
import matplotlib.pyplot as plt

from matplotlib import cbook


def get_demo_image():
    z = cbook.get_sample_data("axes_grid/bivariate_normal.npy")  # 15x15 array
    return z, (-3, 4, -4, 3)


def demo_simple_image(ax):
    Z, extent = get_demo_image()

    im = ax.imshow(Z, extent=extent)
    cb = plt.colorbar(im)
    cb.ax.yaxis.set_tick_params(labelright=False)


def demo_locatable_axes_hard(fig):
    from mpl_toolkits.axes_grid1 import Size, SubplotDivider

    divider = SubplotDivider(fig, 2, 2, 2, aspect=True)

    # Axes for image
    ax = fig.add_subplot(axes_locator=divider.new_locator(nx=0, ny=0))
    # Axes for colorbar
    ax_cb = fig.add_subplot(axes_locator=divider.new_locator(nx=2, ny=0))

    divider.set_horizontal([
        Size.AxesX(ax),  # main Axes
        Size.Fixed(0.05),  # padding, 0.1 inch
        Size.Fixed(0.2),  # colorbar, 0.3 inch
    ])
    divider.set_vertical([Size.AxesY(ax)])

    Z, extent = get_demo_image()

    im = ax.imshow(Z, extent=extent)
    plt.colorbar(im, cax=ax_cb)
    ax_cb.yaxis.set_tick_params(labelright=False)


def demo_locatable_axes_easy(ax):
    from mpl_toolkits.axes_grid1 import make_axes_locatable

    divider = make_axes_locatable(ax)

    ax_cb = divider.append_axes("right", size="5%", pad=0.05)
    fig = ax.get_figure()
    fig.add_axes(ax_cb)

    Z, extent = get_demo_image()
    im = ax.imshow(Z, extent=extent)

    plt.colorbar(im, cax=ax_cb)
    ax_cb.yaxis.tick_right()
    ax_cb.yaxis.set_tick_params(labelright=False)


def demo_images_side_by_side(ax):
    from mpl_toolkits.axes_grid1 import make_axes_locatable

    divider = make_axes_locatable(ax)

    Z, extent = get_demo_image()
    ax2 = divider.append_axes("right", size="100%", pad=0.05)
    fig1 = ax.get_figure()
    fig1.add_axes(ax2)

    ax.imshow(Z, extent=extent)
    ax2.imshow(Z, extent=extent)
    ax2.yaxis.set_tick_params(labelleft=False)


def demo():
    fig = plt.figure(figsize=(6, 6))

    # PLOT 1
    # simple image & colorbar
    ax = fig.add_subplot(2, 2, 1)
    demo_simple_image(ax)

    # PLOT 2
    # image and colorbar with draw-time positioning -- a hard way
    demo_locatable_axes_hard(fig)

    # PLOT 3
    # image and colorbar with draw-time positioning -- an easy way
    ax = fig.add_subplot(2, 2, 3)
    demo_locatable_axes_easy(ax)

    # PLOT 4
    # two images side by side with fixed padding.
    ax = fig.add_subplot(2, 2, 4)
    demo_images_side_by_side(ax)

    plt.show()


demo()
Gesamtlaufzeit des Skripts: (0 Minuten 1,231 Sekunden)