Hinweis
Zum Ende springen, um den vollständigen Beispielcode herunterzuladen.
Beschriftung von Subplots#
Die Beschriftung von Subplots ist relativ einfach und kann variieren, daher hat Matplotlib keine allgemeine Methode dafür.
Wir zeigen zwei Methoden, um Text mit einem bestimmten physischen Offset (in Schriftgrad-Einheiten oder in Punkten) von einer Ecke der Achsen aus zu positionieren: eine mit annotate und eine mit ScaledTranslation.
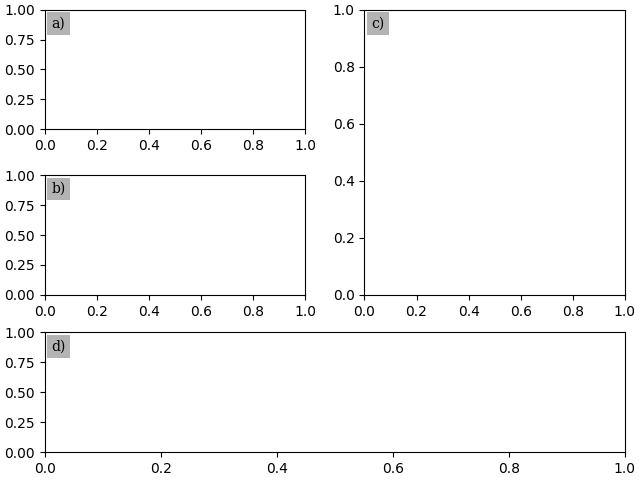
Zur Vereinfachung verwendet dieses Beispiel pyplot.subplot_mosaic und Subplot-Beschriftungen als Schlüssel für die Subplots. Der Ansatz funktioniert jedoch auch mit pyplot.subplots oder Schlüsseln, die sich von dem unterscheiden, womit Sie den Subplot beschriften möchten.
import matplotlib.pyplot as plt

from matplotlib.transforms import ScaledTranslation
fig, axs = plt.subplot_mosaic([['a)', 'c)'], ['b)', 'c)'], ['d)', 'd)']],
                              layout='constrained')
for label, ax in axs.items():
    # Use Axes.annotate to put the label
    # - at the top left corner (axes fraction (0, 1)),
    # - offset half-a-fontsize right and half-a-fontsize down
    #   (offset fontsize (+0.5, -0.5)),
    # i.e. just inside the axes.
    ax.annotate(
        label,
        xy=(0, 1), xycoords='axes fraction',
        xytext=(+0.5, -0.5), textcoords='offset fontsize',
        fontsize='medium', verticalalignment='top', fontfamily='serif',
        bbox=dict(facecolor='0.7', edgecolor='none', pad=3.0))
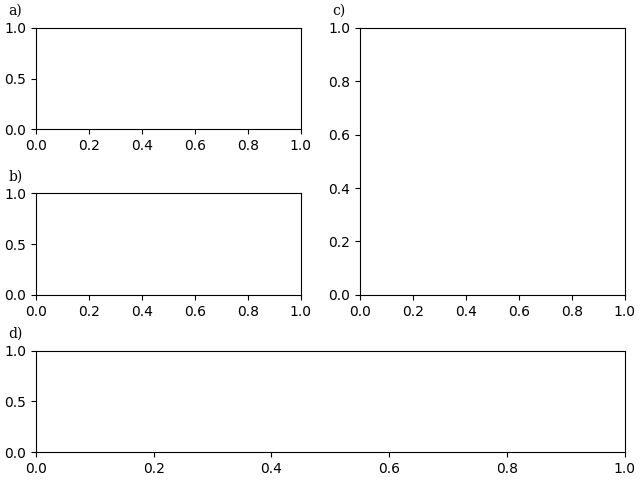
fig, axs = plt.subplot_mosaic([['a)', 'c)'], ['b)', 'c)'], ['d)', 'd)']],
                              layout='constrained')
for label, ax in axs.items():
    # Use ScaledTranslation to put the label
    # - at the top left corner (axes fraction (0, 1)),
    # - offset 20 pixels left and 7 pixels up (offset points (-20, +7)),
    # i.e. just outside the axes.
    ax.text(
        0.0, 1.0, label, transform=(
            ax.transAxes + ScaledTranslation(-20/72, +7/72, fig.dpi_scale_trans)),
        fontsize='medium', va='bottom', fontfamily='serif')
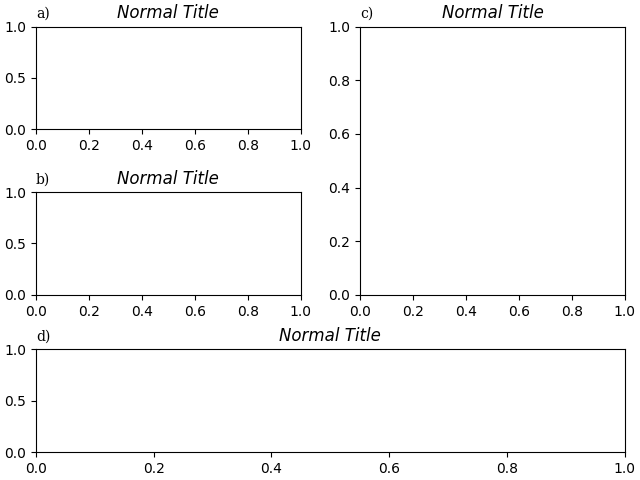
Wenn wir sie mit dem Titel ausrichten wollen, integrieren Sie sie entweder in den Titel oder verwenden Sie das Schlüsselwortargument loc.
fig, axs = plt.subplot_mosaic([['a)', 'c)'], ['b)', 'c)'], ['d)', 'd)']],
                              layout='constrained')
for label, ax in axs.items():
    ax.set_title('Normal Title', fontstyle='italic')
    ax.set_title(label, fontfamily='serif', loc='left', fontsize='medium')

plt.show()
Referenzen
Die Verwendung der folgenden Funktionen, Methoden, Klassen und Module wird in diesem Beispiel gezeigt
Gesamtlaufzeit des Skripts: (0 Minuten 3,407 Sekunden)