Hinweis
Zum Ende springen, um den vollständigen Beispielcode herunterzuladen.
Resampling von Daten#
Downsampling reduziert die Abtastrate oder die Stichprobengröße eines Signals. In diesem Tutorial wird das Signal beim Anpassen des Plots durch Ziehen und Zoomen heruntergetastet.
Hinweis
Dieses Beispiel demonstriert die interaktiven Fähigkeiten von Matplotlib und wird nicht in der statischen Dokumentation angezeigt. Bitte führen Sie diesen Code auf Ihrem Computer aus, um die Interaktivität zu sehen.
Sie können einzelne Teile kopieren und einfügen oder das gesamte Beispiel über den Link am Ende der Seite herunterladen.
import matplotlib.pyplot as plt
import numpy as np


# A class that will downsample the data and recompute when zoomed.
class DataDisplayDownsampler:
    def __init__(self, xdata, y1data, y2data):
        self.origY1Data = y1data
        self.origY2Data = y2data
        self.origXData = xdata
        self.max_points = 50
        self.delta = xdata[-1] - xdata[0]

    def plot(self, ax):
        x, y1, y2 = self._downsample(self.origXData.min(), self.origXData.max())
        (self.line,) = ax.plot(x, y1, 'o-')
        self.poly_collection = ax.fill_between(x, y1, y2, step="pre", color="r")

    def _downsample(self, xstart, xend):
        # get the points in the view range
        mask = (self.origXData > xstart) & (self.origXData < xend)
        # dilate the mask by one to catch the points just outside
        # of the view range to not truncate the line
        mask = np.convolve([1, 1, 1], mask, mode='same').astype(bool)
        # sort out how many points to drop
        ratio = max(np.sum(mask) // self.max_points, 1)

        # mask data
        xdata = self.origXData[mask]
        y1data = self.origY1Data[mask]
        y2data = self.origY2Data[mask]

        # downsample data
        xdata = xdata[::ratio]
        y1data = y1data[::ratio]
        y2data = y2data[::ratio]

        print(f"using {len(y1data)} of {np.sum(mask)} visible points")

        return xdata, y1data, y2data

    def update(self, ax):
        # Update the artists
        lims = ax.viewLim
        if abs(lims.width - self.delta) > 1e-8:
            self.delta = lims.width
            xstart, xend = lims.intervalx
            x, y1, y2 = self._downsample(xstart, xend)
            self.line.set_data(x, y1)
            self.poly_collection.set_data(x, y1, y2, step="pre")
            ax.figure.canvas.draw_idle()


# Create a signal
xdata = np.linspace(16, 365, (365-16)*4)
y1data = np.sin(2*np.pi*xdata/153) + np.cos(2*np.pi*xdata/127)
y2data = y1data + .2

d = DataDisplayDownsampler(xdata, y1data, y2data)

fig, ax = plt.subplots()

# Hook up the line
d.plot(ax)
ax.set_autoscale_on(False)  # Otherwise, infinite loop

# Connect for changing the view limits
ax.callbacks.connect('xlim_changed', d.update)
ax.set_xlim(16, 365)
plt.show()
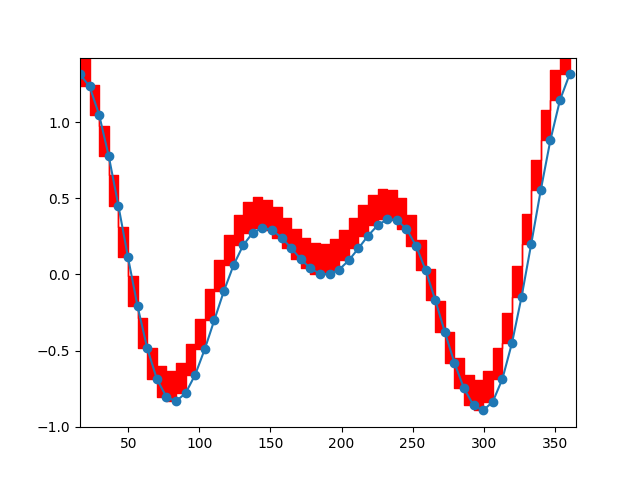
using 52 of 1396 visible points