Hinweis
Gehen Sie zum Ende, um den vollständigen Beispielcode herunterzuladen.
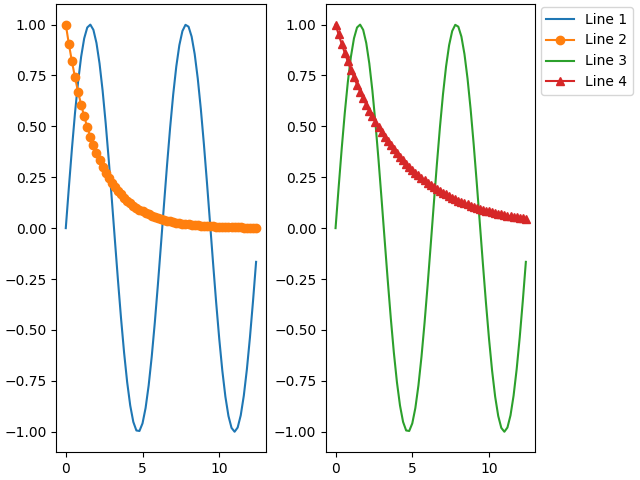
Figure legend demo#
Anstatt eine Legende auf jeder Achse zu plotten, kann stattdessen eine Legende für alle Künstler auf allen Unterachsen einer Figur geplottet werden.
import matplotlib.pyplot as plt
import numpy as np

fig, axs = plt.subplots(1, 2, layout='constrained')

x = np.arange(0.0, 4*np.pi, 0.2)
axs[0].plot(x, np.sin(x), label='Line 1')
axs[0].plot(x, np.exp(-x/2), marker='o', label='Line 2')
axs[1].plot(x, np.sin(x), color='tab:green', label='Line 3')
axs[1].plot(x, np.exp(-x/4), color='tab:red', marker='^', label='Line 4')

fig.legend(loc='outside right upper')

plt.show()
Die Positionierung außerhalb wird hier im Detail besprochen: https://matplotlib.de/stable/users/explain/axes/legend_guide.html#figure-legends
Gesamtlaufzeit des Skripts: (0 Minuten 1,292 Sekunden)