Hinweis
Zum Ende springen, um den vollständigen Beispielcode herunterzuladen.
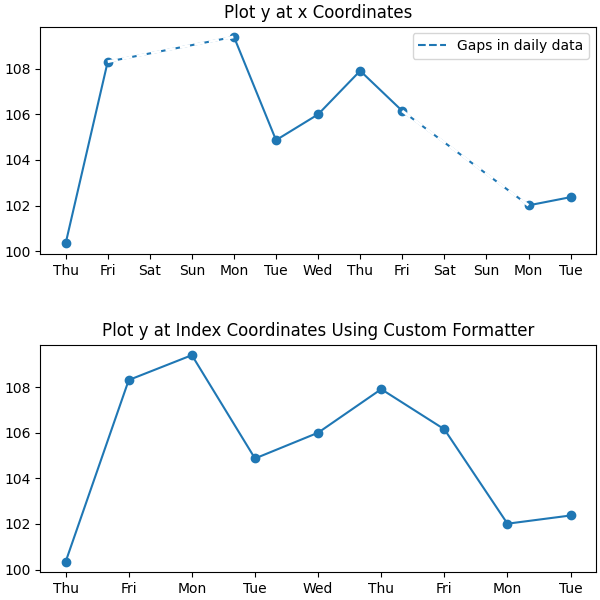
Benutzerdefinierter Tick-Formatter für Zeitreihen#
Beim Plotten von täglichen Daten, z. B. Finanzzeitreihen, möchte man oft Tage, an denen keine Daten vorhanden sind, wie z. B. Wochenenden, auslassen, damit die Daten in regelmäßigen Abständen ohne zusätzliche Leerzeichen für die Tage ohne Daten geplottet werden. Das Beispiel zeigt, wie ein 'Index-Formatter' verwendet wird, um den gewünschten Plot zu erzielen.
import matplotlib.pyplot as plt
import numpy as np

import matplotlib.cbook as cbook
from matplotlib.dates import DateFormatter, DayLocator
import matplotlib.lines as ml
from matplotlib.ticker import Formatter

# Load a structured numpy array from yahoo csv data with fields date, open, high,
# low, close, volume, adj_close from the mpl-data/sample_data directory. The
# record array stores the date as an np.datetime64 with a day unit ('D') in
# the date column (``r['date']``).
r = cbook.get_sample_data('goog.npz')['price_data']
r = r[:9]  # get the first 9 days

fig, (ax1, ax2) = plt.subplots(nrows=2, figsize=(6, 6), layout='constrained')
fig.get_layout_engine().set(hspace=0.15)

# First we'll do it the default way, with gaps on weekends
ax1.plot(r["date"], r["adj_close"], 'o-')

# Highlight gaps in daily data
gaps = np.flatnonzero(np.diff(r["date"]) > np.timedelta64(1, 'D'))
for gap in r[['date', 'adj_close']][np.stack((gaps, gaps + 1)).T]:
    ax1.plot(gap['date'], gap['adj_close'], 'w--', lw=2)
ax1.legend(handles=[ml.Line2D([], [], ls='--', label='Gaps in daily data')])

ax1.set_title("Plot y at x Coordinates")
ax1.xaxis.set_major_locator(DayLocator())
ax1.xaxis.set_major_formatter(DateFormatter('%a'))


# Next we'll write a custom index formatter. Below we will plot
# the data against an index that goes from 0, 1,  ... len(data).  Instead of
# formatting the tick marks as integers, we format as times.
def format_date(x, _):
    try:
        # convert datetime64 to datetime, and use datetime's strftime:
        return r["date"][round(x)].item().strftime('%a')
    except IndexError:
        pass

# Create an index plot (x defaults to range(len(y)) if omitted)
ax2.plot(r["adj_close"], 'o-')

ax2.set_title("Plot y at Index Coordinates Using Custom Formatter")
ax2.xaxis.set_major_formatter(format_date)  # internally creates FuncFormatter
Anstatt eine Funktion in Axis.set_major_formatter zu übergeben, können Sie jeden anderen aufrufbaren Wert verwenden, z. B. eine Instanz einer Klasse, die __call__ implementiert.
class MyFormatter(Formatter):
    def __init__(self, dates, fmt='%a'):
        self.dates = dates
        self.fmt = fmt

    def __call__(self, x, pos=0):
        """Return the label for time x at position pos."""
        try:
            return self.dates[round(x)].item().strftime(self.fmt)
        except IndexError:
            pass


ax2.xaxis.set_major_formatter(MyFormatter(r["date"], '%a'))

plt.show()
Gesamtlaufzeit des Skripts: (0 Minuten 1,480 Sekunden)