Hinweis
Zum Ende springen, um den vollständigen Beispielcode herunterzuladen.
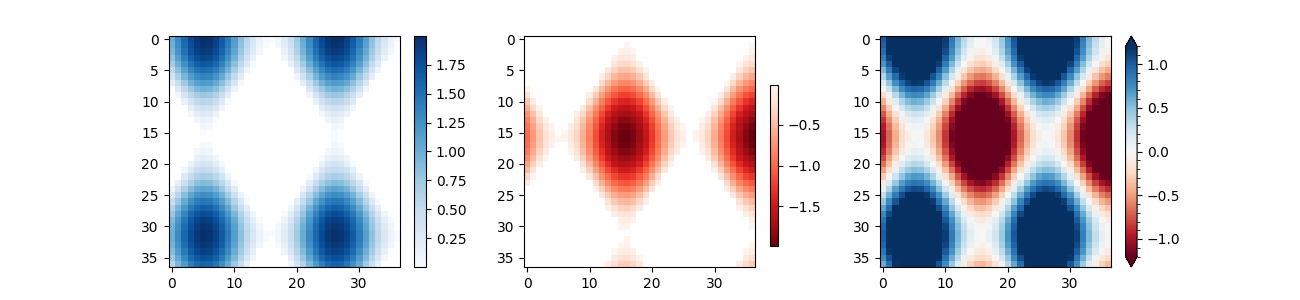
Farbleiste#
Verwenden Sie colorbar, indem Sie das abbildbare Objekt (hier das von AxesImage zurückgegebene imshow) und die Achsen angeben, an die die Farbleiste angehängt werden soll.
import matplotlib.pyplot as plt
import numpy as np

# setup some generic data
N = 37
x, y = np.mgrid[:N, :N]
Z = (np.cos(x*0.2) + np.sin(y*0.3))

# mask out the negative and positive values, respectively
Zpos = np.ma.masked_less(Z, 0)
Zneg = np.ma.masked_greater(Z, 0)

fig, (ax1, ax2, ax3) = plt.subplots(figsize=(13, 3), ncols=3)

# plot just the positive data and save the
# color "mappable" object returned by ax1.imshow
pos = ax1.imshow(Zpos, cmap='Blues', interpolation='none')

# add the colorbar using the figure's method,
# telling which mappable we're talking about and
# which Axes object it should be near
fig.colorbar(pos, ax=ax1)

# repeat everything above for the negative data
# you can specify location, anchor and shrink the colorbar
neg = ax2.imshow(Zneg, cmap='Reds_r', interpolation='none')
fig.colorbar(neg, ax=ax2, location='right', anchor=(0, 0.3), shrink=0.7)

# Plot both positive and negative values between +/- 1.2
pos_neg_clipped = ax3.imshow(Z, cmap='RdBu', vmin=-1.2, vmax=1.2,
                             interpolation='none')
# Add minorticks on the colorbar to make it easy to read the
# values off the colorbar.
cbar = fig.colorbar(pos_neg_clipped, ax=ax3, extend='both')
cbar.minorticks_on()
plt.show()
Referenzen
Die Verwendung der folgenden Funktionen, Methoden, Klassen und Module wird in diesem Beispiel gezeigt