Hinweis
Zum Ende springen, um den vollständigen Beispielcode herunterzuladen.
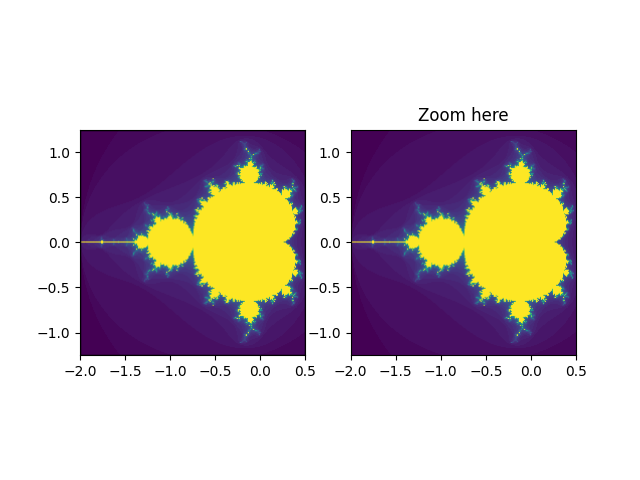
Viewlims#
Erstellt zwei identische Panels. Wenn Sie in das rechte Panel zoomen, wird im ersten Panel ein Rechteck angezeigt, das den gezoomten Bereich kennzeichnet.
Hinweis
Dieses Beispiel demonstriert die interaktiven Fähigkeiten von Matplotlib und wird nicht in der statischen Dokumentation angezeigt. Bitte führen Sie diesen Code auf Ihrem Computer aus, um die Interaktivität zu sehen.
Sie können einzelne Teile kopieren und einfügen oder das gesamte Beispiel über den Link am Ende der Seite herunterladen.
import functools

import matplotlib.pyplot as plt
import numpy as np

from matplotlib.patches import Rectangle


# A class that will regenerate a fractal set as we zoom in, so that you
# can actually see the increasing detail.  A box in the left panel will show
# the area to which we are zoomed.
class MandelbrotDisplay:
    def __init__(self, h=500, w=500, niter=50, radius=2., power=2):
        self.height = h
        self.width = w
        self.niter = niter
        self.radius = radius
        self.power = power

    def compute_image(self, xlim, ylim):
        self.x = np.linspace(*xlim, self.width)
        self.y = np.linspace(*ylim, self.height).reshape(-1, 1)
        c = self.x + 1.0j * self.y
        threshold_time = np.zeros((self.height, self.width))
        z = np.zeros(threshold_time.shape, dtype=complex)
        mask = np.ones(threshold_time.shape, dtype=bool)
        for i in range(self.niter):
            z[mask] = z[mask]**self.power + c[mask]
            mask = (np.abs(z) < self.radius)
            threshold_time += mask
        return threshold_time

    def ax_update(self, ax):
        ax.set_autoscale_on(False)  # Otherwise, infinite loop
        # Get the number of points from the number of pixels in the window
        self.width, self.height = ax.patch.get_window_extent().size.round().astype(int)
        # Update the image object with our new data and extent
        ax.images[-1].set(data=self.compute_image(ax.get_xlim(), ax.get_ylim()),
                          extent=(*ax.get_xlim(), *ax.get_ylim()))
        ax.figure.canvas.draw_idle()


md = MandelbrotDisplay()

fig1, (ax_full, ax_zoom) = plt.subplots(1, 2)
ax_zoom.imshow([[0]], origin="lower")  # Empty initial image.
ax_zoom.set_title("Zoom here")

rect = Rectangle(
    [0, 0], 0, 0, facecolor="none", edgecolor="black", linewidth=1.0)
ax_full.add_patch(rect)


def update_rect(rect, ax):  # Let the rectangle track the bounds of the zoom axes.
    xlo, xhi = ax.get_xlim()
    ylo, yhi = ax.get_ylim()
    rect.set_bounds((xlo, ylo, xhi - xlo, yhi - ylo))
    ax.figure.canvas.draw_idle()


# Connect for changing the view limits.
ax_zoom.callbacks.connect("xlim_changed", functools.partial(update_rect, rect))
ax_zoom.callbacks.connect("ylim_changed", functools.partial(update_rect, rect))

ax_zoom.callbacks.connect("xlim_changed", md.ax_update)
ax_zoom.callbacks.connect("ylim_changed", md.ax_update)

# Initialize: trigger image computation by setting view limits; set colormap limits;
# copy image to full view.
ax_zoom.set(xlim=(-2, .5), ylim=(-1.25, 1.25))
im = ax_zoom.images[0]
ax_zoom.images[0].set(clim=(im.get_array().min(), im.get_array().max()))
ax_full.imshow(im.get_array(), extent=im.get_extent(), origin="lower")

plt.show()