Hinweis
Zum Ende springen, um den vollständigen Beispielcode herunterzuladen.
Figure Subfigures#
Manchmal ist es wünschenswert, eine Abbildung mit zwei unterschiedlichen Layouts zu haben. Dies kann mit verschachtelten Gridspecs erreicht werden, aber eine virtuelle Abbildung mit eigenen Künstlern ist hilfreich, daher hat Matplotlib auch "Subfigures", die durch Aufruf von matplotlib.figure.Figure.add_subfigure analog zu matplotlib.figure.Figure.add_subplot oder matplotlib.figure.Figure.subfigures zum Erstellen eines Arrays von Subfigures aufgerufen werden kann. Beachten Sie, dass Subfigures auch ihre eigenen untergeordneten Subfigures haben können.
import matplotlib.pyplot as plt
import numpy as np
def example_plot(ax, fontsize=12, hide_labels=False):
pc = ax.pcolormesh(np.random.randn(30, 30), vmin=-2.5, vmax=2.5)
if not hide_labels:
ax.set_xlabel('x-label', fontsize=fontsize)
ax.set_ylabel('y-label', fontsize=fontsize)
ax.set_title('Title', fontsize=fontsize)
return pc
np.random.seed(19680808)
# gridspec inside gridspec
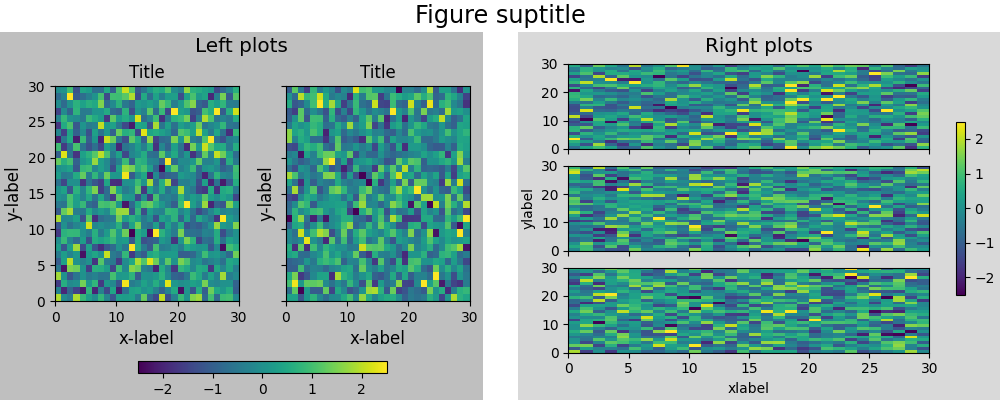
fig = plt.figure(layout='constrained', figsize=(10, 4))
subfigs = fig.subfigures(1, 2, wspace=0.07)
axsLeft = subfigs[0].subplots(1, 2, sharey=True)
subfigs[0].set_facecolor('0.75')
for ax in axsLeft:
pc = example_plot(ax)
subfigs[0].suptitle('Left plots', fontsize='x-large')
subfigs[0].colorbar(pc, shrink=0.6, ax=axsLeft, location='bottom')
axsRight = subfigs[1].subplots(3, 1, sharex=True)
for nn, ax in enumerate(axsRight):
pc = example_plot(ax, hide_labels=True)
if nn == 2:
ax.set_xlabel('xlabel')
if nn == 1:
ax.set_ylabel('ylabel')
subfigs[1].set_facecolor('0.85')
subfigs[1].colorbar(pc, shrink=0.6, ax=axsRight)
subfigs[1].suptitle('Right plots', fontsize='x-large')
fig.suptitle('Figure suptitle', fontsize='xx-large')
plt.show()
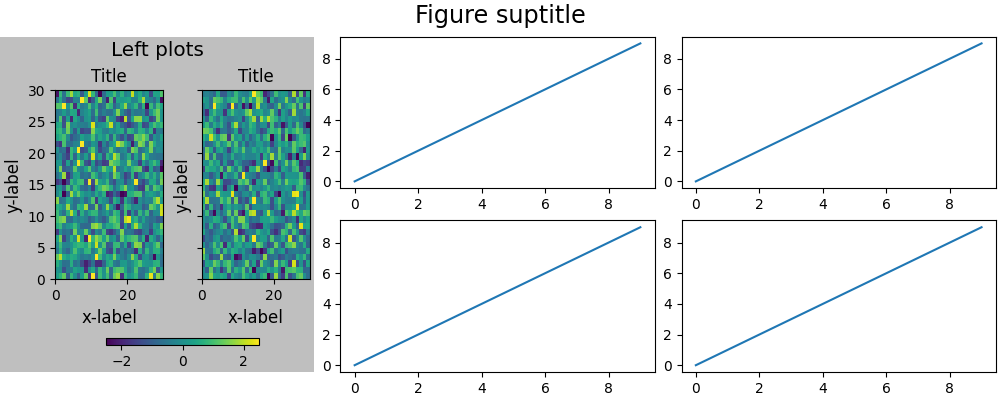
Es ist möglich, Subplots und Subfigures mit matplotlib.figure.Figure.add_subfigure zu mischen. Dies erfordert den Zugriff auf das Gridspec, auf dem die Subplots angeordnet sind.
fig, axs = plt.subplots(2, 3, layout='constrained', figsize=(10, 4))
gridspec = axs[0, 0].get_subplotspec().get_gridspec()

# clear the left column for the subfigure:
for a in axs[:, 0]:
    a.remove()

# plot data in remaining Axes:
for a in axs[:, 1:].flat:
    a.plot(np.arange(10))

# make the subfigure in the empty gridspec slots:
subfig = fig.add_subfigure(gridspec[:, 0])

axsLeft = subfig.subplots(1, 2, sharey=True)
subfig.set_facecolor('0.75')
for ax in axsLeft:
    pc = example_plot(ax)
subfig.suptitle('Left plots', fontsize='x-large')
subfig.colorbar(pc, shrink=0.6, ax=axsLeft, location='bottom')

fig.suptitle('Figure suptitle', fontsize='xx-large')
plt.show()
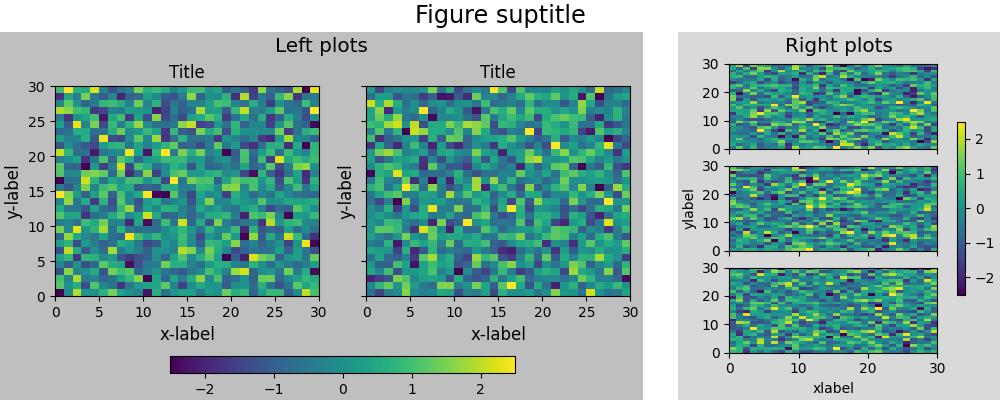
Subfigures können unterschiedliche Breiten und Höhen haben. Dies ist genau dasselbe Beispiel wie das erste, aber *width_ratios* wurde geändert
fig = plt.figure(layout='constrained', figsize=(10, 4))
subfigs = fig.subfigures(1, 2, wspace=0.07, width_ratios=[2, 1])

axsLeft = subfigs[0].subplots(1, 2, sharey=True)
subfigs[0].set_facecolor('0.75')
for ax in axsLeft:
    pc = example_plot(ax)
subfigs[0].suptitle('Left plots', fontsize='x-large')
subfigs[0].colorbar(pc, shrink=0.6, ax=axsLeft, location='bottom')

axsRight = subfigs[1].subplots(3, 1, sharex=True)
for nn, ax in enumerate(axsRight):
    pc = example_plot(ax, hide_labels=True)
    if nn == 2:
        ax.set_xlabel('xlabel')
    if nn == 1:
        ax.set_ylabel('ylabel')

subfigs[1].set_facecolor('0.85')
subfigs[1].colorbar(pc, shrink=0.6, ax=axsRight)
subfigs[1].suptitle('Right plots', fontsize='x-large')

fig.suptitle('Figure suptitle', fontsize='xx-large')

plt.show()
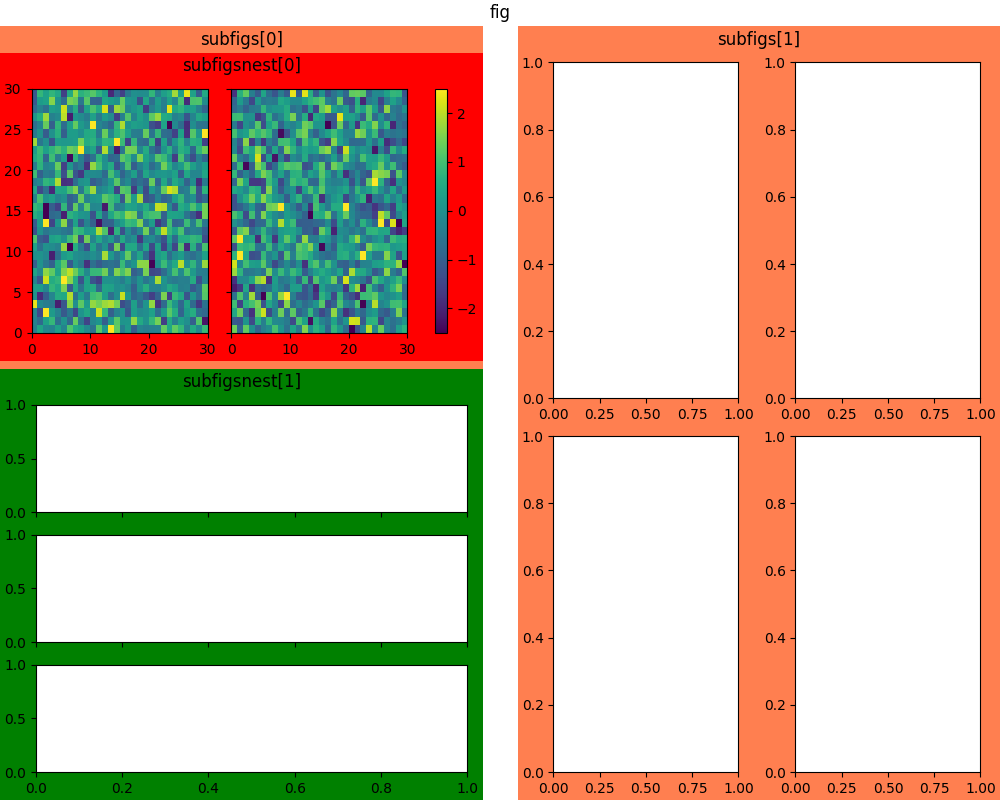
Subfigures können auch verschachtelt werden
fig = plt.figure(layout='constrained', figsize=(10, 8))

fig.suptitle('fig')

subfigs = fig.subfigures(1, 2, wspace=0.07)

subfigs[0].set_facecolor('coral')
subfigs[0].suptitle('subfigs[0]')

subfigs[1].set_facecolor('coral')
subfigs[1].suptitle('subfigs[1]')

subfigsnest = subfigs[0].subfigures(2, 1, height_ratios=[1, 1.4])
subfigsnest[0].suptitle('subfigsnest[0]')
subfigsnest[0].set_facecolor('r')
axsnest0 = subfigsnest[0].subplots(1, 2, sharey=True)
for nn, ax in enumerate(axsnest0):
    pc = example_plot(ax, hide_labels=True)
subfigsnest[0].colorbar(pc, ax=axsnest0)

subfigsnest[1].suptitle('subfigsnest[1]')
subfigsnest[1].set_facecolor('g')
axsnest1 = subfigsnest[1].subplots(3, 1, sharex=True)

axsRight = subfigs[1].subplots(2, 2)

plt.show()
Gesamtlaufzeit des Skripts: (0 Minuten 6,697 Sekunden)