Hinweis
Zum Ende gehen, um den vollständigen Beispielcode herunterzuladen.
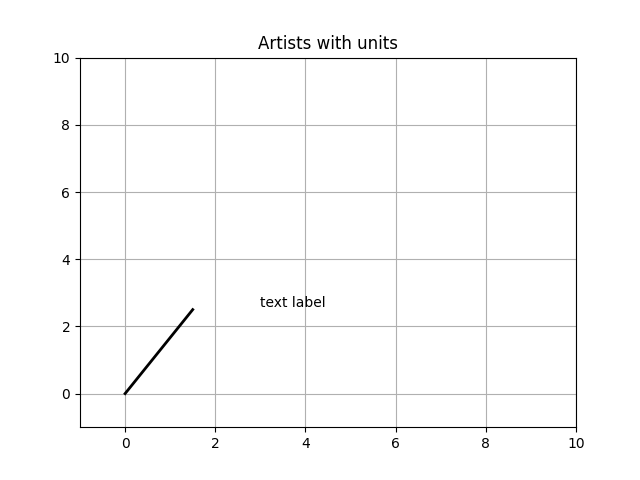
Künstler-Tests#
Testen Sie die Unterstützung von Einheiten bei jedem der primitiven Künstler-Typen von Matplotlib.
Die Achse verarbeitet Einheitenumrechnungen und die Künstler behalten einen Verweis auf ihre Achsen-Eltern. Sie müssen die Künstler mit der Achseninstanz initialisieren, wenn Sie sie mit Einheitsdaten verwenden möchten, da sie sonst nicht wissen, wie sie die Einheiten in Skalare umrechnen sollen.
Dieses Beispiel erfordert basic_units.py
import random

from basic_units import cm, inch

import matplotlib.pyplot as plt
import numpy as np

import matplotlib.collections as collections
import matplotlib.lines as lines
import matplotlib.patches as patches
import matplotlib.text as text

fig, ax = plt.subplots()
ax.xaxis.set_units(cm)
ax.yaxis.set_units(cm)

# Fixing random state for reproducibility
np.random.seed(19680801)

if 0:
    # test a line collection
    # Not supported at present.
    verts = []
    for i in range(10):
        # a random line segment in inches
        verts.append(zip(*inch*10*np.random.rand(2, random.randint(2, 15))))
    lc = collections.LineCollection(verts, axes=ax)
    ax.add_collection(lc)

# test a plain-ol-line
line = lines.Line2D([0*cm, 1.5*cm], [0*cm, 2.5*cm],
                    lw=2, color='black', axes=ax)
ax.add_line(line)

if 0:
    # test a patch
    # Not supported at present.
    rect = patches.Rectangle((1*cm, 1*cm), width=5*cm, height=2*cm,
                             alpha=0.2, axes=ax)
    ax.add_patch(rect)


t = text.Text(3*cm, 2.5*cm, 'text label', ha='left', va='bottom', axes=ax)
ax.add_artist(t)

ax.set_xlim(-1*cm, 10*cm)
ax.set_ylim(-1*cm, 10*cm)
# ax.xaxis.set_units(inch)
ax.grid(True)
ax.set_title("Artists with units")
plt.show()