Hinweis
Gehen Sie zum Ende, um den vollständigen Beispielcode herunterzuladen.
Achsen-Ticks#
Die X- und Y-Achse jeder Achse haben standardmäßige "Locators" und "Formatters" für Ticks, die vom verwendeten Maßstab abhängen (siehe Achsen-Maßstäbe). Es ist möglich, die Ticks und Tick-Beschriftungen mit High-Level-Methoden wie set_xticks anzupassen oder die Locators und Formatters direkt auf der Achse festzulegen.
Manuelle Position und Formate#
Die einfachste Methode zur Anpassung der Tick-Positionen und -Formate ist die Verwendung von set_xticks und set_yticks. Diese können entweder für die Haupt- oder die Neben-Ticks verwendet werden.
import numpy as np
import matplotlib.pyplot as plt

import matplotlib.ticker as ticker


fig, axs = plt.subplots(2, 1, figsize=(5.4, 5.4), layout='constrained')
x = np.arange(100)
for nn, ax in enumerate(axs):
    ax.plot(x, x)
    if nn == 1:
        ax.set_title('Manual ticks')
        ax.set_yticks(np.arange(0, 100.1, 100/3))
        xticks = np.arange(0.50, 101, 20)
        xlabels = [f'\\${x:1.2f}' for x in xticks]
        ax.set_xticks(xticks, labels=xlabels)
    else:
        ax.set_title('Automatic ticks')
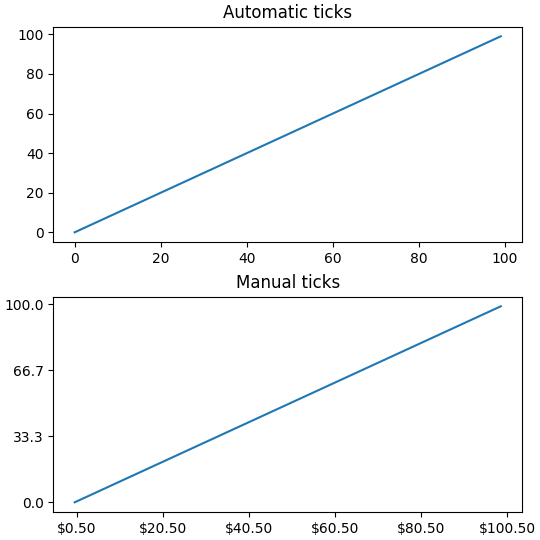
Beachten Sie, dass die Länge des Arguments labels mit der Länge des Arrays übereinstimmen muss, das zur Angabe der Ticks verwendet wird.
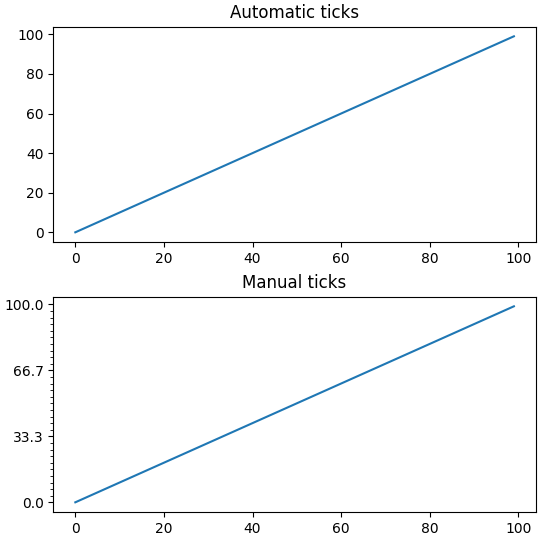
Standardmäßig wirken set_xticks und set_yticks auf die Haupt-Ticks einer Achse, es ist jedoch möglich, Neben-Ticks hinzuzufügen.
fig, axs = plt.subplots(2, 1, figsize=(5.4, 5.4), layout='constrained')
x = np.arange(100)
for nn, ax in enumerate(axs):
    ax.plot(x, x)
    if nn == 1:
        ax.set_title('Manual ticks')
        ax.set_yticks(np.arange(0, 100.1, 100/3))
        ax.set_yticks(np.arange(0, 100.1, 100/30), minor=True)
    else:
        ax.set_title('Automatic ticks')
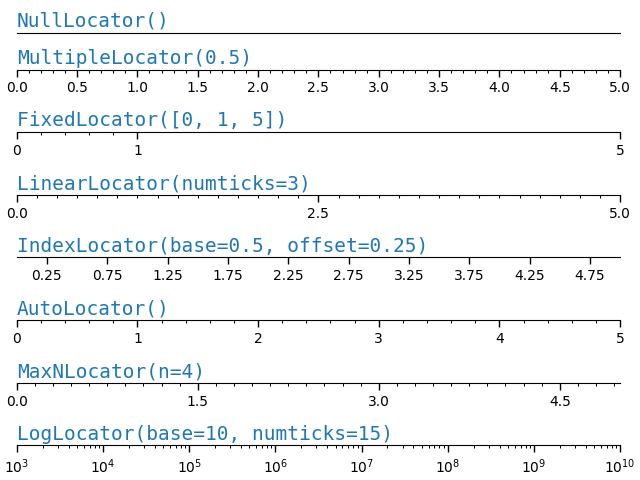
Locators und Formatters#
Das manuelle Festlegen der Ticks wie oben funktioniert gut für spezifische finale Plots, passt sich aber nicht an, wenn der Benutzer mit den Achsen interagiert. Auf einer niedrigeren Ebene verfügt Matplotlib über Locators, die dazu gedacht sind, Ticks automatisch basierend auf den aktuellen Ansichtsgrenzen der Achse auszuwählen, und Formatters, die dazu gedacht sind, die Tick-Beschriftungen automatisch zu formatieren.
Die vollständige Liste der von Matplotlib bereitgestellten Locators finden Sie unter Tick-Lokalisierung, und die Formatters unter Tick-Formatierung.
def setup(ax, title):
    """Set up common parameters for the Axes in the example."""
    # only show the bottom spine
    ax.yaxis.set_major_locator(ticker.NullLocator())
    ax.spines[['left', 'right', 'top']].set_visible(False)

    ax.xaxis.set_ticks_position('bottom')
    ax.tick_params(which='major', width=1.00, length=5)
    ax.tick_params(which='minor', width=0.75, length=2.5)
    ax.set_xlim(0, 5)
    ax.set_ylim(0, 1)
    ax.text(0.0, 0.2, title, transform=ax.transAxes,
            fontsize=14, fontname='Monospace', color='tab:blue')


fig, axs = plt.subplots(8, 1, layout='constrained')

# Null Locator
setup(axs[0], title="NullLocator()")
axs[0].xaxis.set_major_locator(ticker.NullLocator())
axs[0].xaxis.set_minor_locator(ticker.NullLocator())

# Multiple Locator
setup(axs[1], title="MultipleLocator(0.5)")
axs[1].xaxis.set_major_locator(ticker.MultipleLocator(0.5))
axs[1].xaxis.set_minor_locator(ticker.MultipleLocator(0.1))

# Fixed Locator
setup(axs[2], title="FixedLocator([0, 1, 5])")
axs[2].xaxis.set_major_locator(ticker.FixedLocator([0, 1, 5]))
axs[2].xaxis.set_minor_locator(ticker.FixedLocator(np.linspace(0.2, 0.8, 4)))

# Linear Locator
setup(axs[3], title="LinearLocator(numticks=3)")
axs[3].xaxis.set_major_locator(ticker.LinearLocator(3))
axs[3].xaxis.set_minor_locator(ticker.LinearLocator(31))

# Index Locator
setup(axs[4], title="IndexLocator(base=0.5, offset=0.25)")
axs[4].plot(range(0, 5), [0]*5, color='white')
axs[4].xaxis.set_major_locator(ticker.IndexLocator(base=0.5, offset=0.25))

# Auto Locator
setup(axs[5], title="AutoLocator()")
axs[5].xaxis.set_major_locator(ticker.AutoLocator())
axs[5].xaxis.set_minor_locator(ticker.AutoMinorLocator())

# MaxN Locator
setup(axs[6], title="MaxNLocator(n=4)")
axs[6].xaxis.set_major_locator(ticker.MaxNLocator(4))
axs[6].xaxis.set_minor_locator(ticker.MaxNLocator(40))

# Log Locator
setup(axs[7], title="LogLocator(base=10, numticks=15)")
axs[7].set_xlim(10**3, 10**10)
axs[7].set_xscale('log')
axs[7].xaxis.set_major_locator(ticker.LogLocator(base=10, numticks=15))
plt.show()
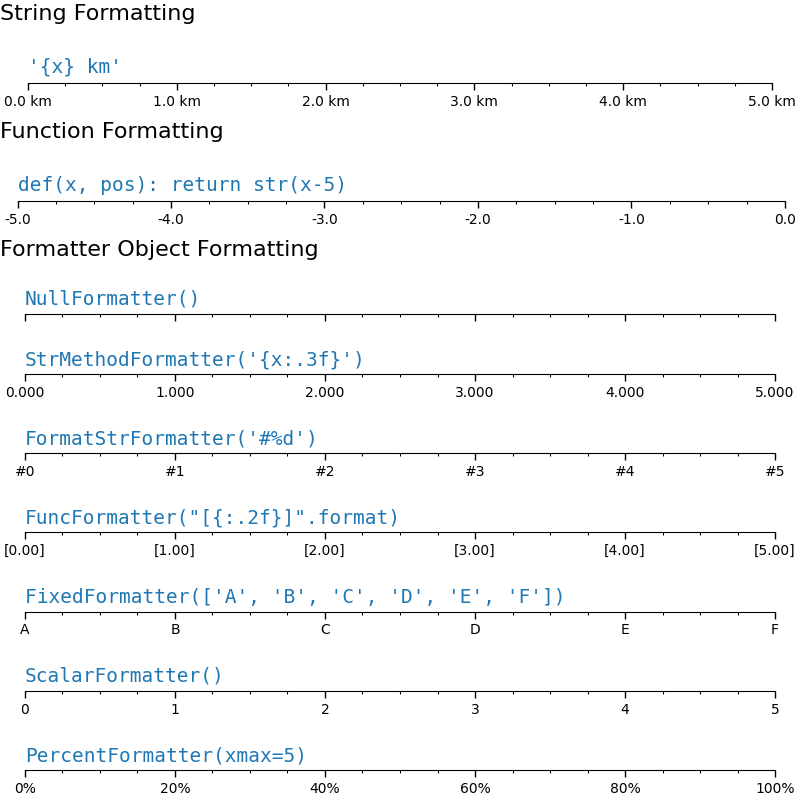
Ähnlich können wir "Formatters" für die Haupt- und Neben-Ticks auf jeder Achse angeben.
Das Tick-Format wird über die Funktion set_major_formatter oder set_minor_formatter konfiguriert. Sie akzeptiert
einen Format-String, der implizit einen
StrMethodFormattererstellt.eine Funktion, die implizit einen
FuncFormattererstellt.eine Instanz einer
Formatter-Unterklasse. Die gebräuchlichsten sindNullFormatter: Keine Beschriftungen an den Ticks.StrMethodFormatter: Verwendet die String-Methodestr.format.FormatStrFormatter: Verwendet die %-Formatierung.FuncFormatter: Definiert Beschriftungen durch eine Funktion.FixedFormatter: Legt die Beschriftungsstrings explizit fest.ScalarFormatter: Standard-Formatter für Skalare: automatische Auswahl des Format-Strings.PercentFormatter: Formatiert Beschriftungen als Prozentwert.
Siehe Tick-Formatierung für die vollständige Liste.
def setup(ax, title):
    """Set up common parameters for the Axes in the example."""
    # only show the bottom spine
    ax.yaxis.set_major_locator(ticker.NullLocator())
    ax.spines[['left', 'right', 'top']].set_visible(False)

    # define tick positions
    ax.xaxis.set_major_locator(ticker.MultipleLocator(1.00))
    ax.xaxis.set_minor_locator(ticker.MultipleLocator(0.25))

    ax.xaxis.set_ticks_position('bottom')
    ax.tick_params(which='major', width=1.00, length=5)
    ax.tick_params(which='minor', width=0.75, length=2.5, labelsize=10)
    ax.set_xlim(0, 5)
    ax.set_ylim(0, 1)
    ax.text(0.0, 0.2, title, transform=ax.transAxes,
            fontsize=14, fontname='Monospace', color='tab:blue')


fig = plt.figure(figsize=(8, 8), layout='constrained')
fig0, fig1, fig2 = fig.subfigures(3, height_ratios=[1.5, 1.5, 7.5])

fig0.suptitle('String Formatting', fontsize=16, x=0, ha='left')
ax0 = fig0.subplots()

setup(ax0, title="'{x} km'")
ax0.xaxis.set_major_formatter('{x} km')

fig1.suptitle('Function Formatting', fontsize=16, x=0, ha='left')
ax1 = fig1.subplots()

setup(ax1, title="def(x, pos): return str(x-5)")
ax1.xaxis.set_major_formatter(lambda x, pos: str(x-5))

fig2.suptitle('Formatter Object Formatting', fontsize=16, x=0, ha='left')
axs2 = fig2.subplots(7, 1)

setup(axs2[0], title="NullFormatter()")
axs2[0].xaxis.set_major_formatter(ticker.NullFormatter())

setup(axs2[1], title="StrMethodFormatter('{x:.3f}')")
axs2[1].xaxis.set_major_formatter(ticker.StrMethodFormatter("{x:.3f}"))

setup(axs2[2], title="FormatStrFormatter('#%d')")
axs2[2].xaxis.set_major_formatter(ticker.FormatStrFormatter("#%d"))


def fmt_two_digits(x, pos):
    return f'[{x:.2f}]'


setup(axs2[3], title='FuncFormatter("[{:.2f}]".format)')
axs2[3].xaxis.set_major_formatter(ticker.FuncFormatter(fmt_two_digits))

setup(axs2[4], title="FixedFormatter(['A', 'B', 'C', 'D', 'E', 'F'])")
# FixedFormatter should only be used together with FixedLocator.
# Otherwise, one cannot be sure where the labels will end up.
positions = [0, 1, 2, 3, 4, 5]
labels = ['A', 'B', 'C', 'D', 'E', 'F']
axs2[4].xaxis.set_major_locator(ticker.FixedLocator(positions))
axs2[4].xaxis.set_major_formatter(ticker.FixedFormatter(labels))

setup(axs2[5], title="ScalarFormatter()")
axs2[5].xaxis.set_major_formatter(ticker.ScalarFormatter(useMathText=True))

setup(axs2[6], title="PercentFormatter(xmax=5)")
axs2[6].xaxis.set_major_formatter(ticker.PercentFormatter(xmax=5))
Styling von Ticks (Tick-Parameter)#
Das Aussehen von Ticks kann auf niedriger Ebene gesteuert werden, indem die einzelnen Tick auf der Achse gefunden werden. Normalerweise ist es jedoch am einfachsten, tick_params zu verwenden, um alle Objekte auf einmal zu ändern.
Die Methode tick_params kann die Eigenschaften von Ticks ändern
Länge
Richtung (in oder aus dem Rahmen)
Farben
Breite und Länge
und ob die Ticks am unteren, oberen, linken oder rechten Rand der Achse gezeichnet werden.
Sie kann auch die Tick-Beschriftungen steuern
Schriftgröße (fontsize)
Beschriftungsfarbe (Farbe der Beschriftung)
Beschriftungsdrehung
labelbottom, labeltop, labelleft, labelright
Zusätzlich gibt es ein Schlüsselwortargument *pad*, das angibt, wie weit die Tick-Beschriftung vom Tick entfernt ist.
Schließlich können die Gitterlinienstile festgelegt werden
Gitterfarbe
Gitter-Alpha
Gitter-Linienbreite
Gitter-Linienstil
Alle diese Eigenschaften können auf eine Achse beschränkt und nur auf die Haupt- oder Neben-Ticks angewendet werden.
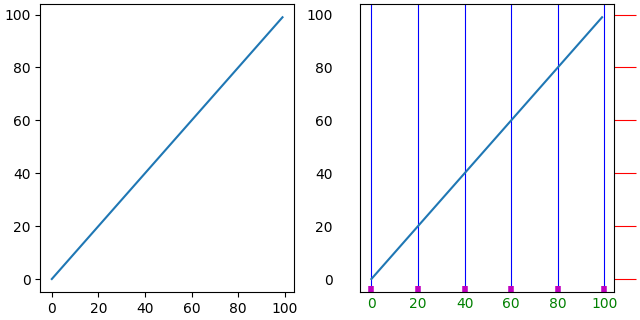
fig, axs = plt.subplots(1, 2, figsize=(6.4, 3.2), layout='constrained')

for nn, ax in enumerate(axs):
    ax.plot(np.arange(100))
    if nn == 1:
        ax.grid('on')
        ax.tick_params(right=True, left=False, axis='y', color='r', length=16,
                       grid_color='none')
        ax.tick_params(axis='x', color='m', length=4, direction='in', width=4,
                       labelcolor='g', grid_color='b')
Gesamtlaufzeit des Skripts: (0 Minuten 7,352 Sekunden)