Hinweis
Zum Ende springen, um den vollständigen Beispielcode herunterzuladen.
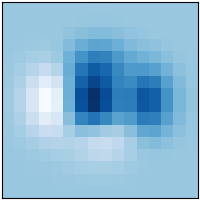
imshow(Z)#
Zeigt Daten als Bild an, d.h. auf einem 2D-regulären Raster.
Siehe imshow.
import matplotlib.pyplot as plt
import numpy as np

plt.style.use('_mpl-gallery-nogrid')

# make data
X, Y = np.meshgrid(np.linspace(-3, 3, 16), np.linspace(-3, 3, 16))
Z = (1 - X/2 + X**5 + Y**3) * np.exp(-X**2 - Y**2)

# plot
fig, ax = plt.subplots()

ax.imshow(Z, origin='lower')

plt.show()